The greenhouse effect that wasn’t (Part 1)
This turned out to be a longer post (the first of two) than what I had originally planned. The actual presentation and analysis of data starts only about halfway through. If you don’t much care for my ranting about how ‘the climate establishment’ deliberately employ specious arguments and methods to try and make us believe and perceive that clouds somehow massively warm the Earth even when they’re not, then please feel free to scroll past the first three or four sections.
THE NEGATIVE “CLOUD GREENHOUSE EFFECT”
Yes, we have all experienced how clouds covering the sky on a sunny day will tend to cool things down. Heck, shade or sunshine, which is hotter? Likewise, I think most of us can attest to the experience of how a cloudy night will be milder than a clear one.
These two different ‘cloud effects’ work in opposite directions. During the day, the heat comes in from the Sun: Qin. If you then pull a blanket or something similar between you and the heat source, you will (hopefully) avoid being overheated. People living in deserts know all about this principle. They wear their long, loose, bright garments not to stay warm, but in order to stay cool. Note, there is also heat going out (from the surface) during the day (Qout) – a direct consequence of the original solar heat input. But in most cases, this is totally overwhelmed by the incoming solar heat, so much so that it’s normally forgotten about, unless you happen to step onto a hot pavement or sand. Since the outgoing heat is also very much dependent on the original solar heating, reducing Qin during the day would also necessarily reduce Qout.
During the night, there is no more heat coming in from the Sun. There is only the heat going out, at this point from excess solar energy having accumulated during the day. So the surface is no longer being heated. Its temperature is dropping. It loses energy (as heat). Cooling. It cools directly to space, but also substantially to the air/atmosphere above it, which then in turn cools to space from higher up on its behalf, so to say. What happens if we now pull a blanket over the scene? Well, the remaining heat source, the ground, is now obstructed from direct access to its ultimate cold reservoir, space. The heat being expelled is to a much lesser degree able to go straight to the outer, icy cold heat sink, it goes rather to the more warmish layer in between. Reducing the overall gradient, thus reducing the cooling rate. People living in cold places know all about this principle. They wear thick, heavy, fluffy clothes in multiple layers, not to stay cool, but to stay warm.
The wonders of insulation! It works both ways. You only need to figure out where the principal heat is coming from.
OK, so this should be our starting point: Clouds exert both an indirect ‘cooling’ and an indirect ‘warming’ influence on surface temperatures. They take away from the solar input during the day (>Qin), and they reduce the ground’s cooling rate during the night (>Qout).
So which of these contrary ‘cloud effects’ is stronger?
Well, the heading above should give you an inkling of sorts. But I fear we will have to wind our way forward a bit before reaching final enlightenment.
First we need to revisit an old friend. Yes, that old friend …
What is this “atmospheric radiative greenhouse effect” (rGHE) that everyone seems to be taking for granted as a real phenomenon all the time?
Yet another stripped-down definition:
- The rGHE is an assumed fact that Earth’s global atmosphere lets less thermal radiation (LWIR) escape into space than what Earth’s global surface releases into the atmosphere – the assumption behind this ‘fact’ lies in the Stefan-Boltzmann calculation of surface radiative flux.
- From this perspective, the global mean difference between the outgoing radiative flux from the surface (into the bottom of the atmosphere (BoA)) and the outgoing radiative flux from the top of the atmosphere (ToA), is about 150-160 W/m2, depending on who you ask.
- This figure is simply arrived at by subtracting the actually measured (averaged) ToA flux from Earth to space, as read by satellite-borne instruments such as CERES, from the purely Stefan-Boltzmann-calculated surface flux: [~395 – 240 =] 155 W/m2.
Chris Colose provides a succinct summary:
“The greenhouse effect is defined by the difference in upwelling radiation flux at surface and the flux at the top of the atmosphere. With no greenhouse effect, this difference is zero. In the present-day climate, this difference is about 155 W m-2; this atmospheric absorption and emission is what drives the ~33 K enhancement of surface temperatures above the no-greenhouse (and constant albedo) case.”
(Yes, there is that 33K figure. And take note of the ‘constant albedo’ stipulation. It might seem a trivial point right now, but it will end up making all the difference. To this post at least …)
Apparently, then, the atmosphere at all times takes 155 W/m2 of the outgoing surface radiative flux for itself. It in effect holds it forever ‘trapped’ inside the Earth system. That is, an excess of energy, even at dynamic equilibrium, is allegedly always kept within the atmosphere rather than within more natural, much larger reservoirs, like the ocean. This is because the energy, according to the rGHE hypothesis, thus ‘trapped’, is not really stored anywhere, as in just being a static fund of internal energy [U], like ‘ocean heat content’ (OHC). It is rather spun into a neverending flux loop constantly transferring this energy back and forth between different internal domains of the Earth system, creating extra warming in all directions. (We discussed this nonsensical approach to reality here.)
Anyhow, this is the very simple basics of, the fundamental reasoning behind, the rGHE hypothesis: Whatever impedes outgoing surface radiation from reaching space, will make the Earth system warmer.
Such an idea, of course, requires that we first agree to the direct Stefan-Boltzmann treatment of the surface and its radiated energy (as if it were in a purely radiative situation), and thereby accept the notion that some of the energy thus at all times radiated from the surface in fact never reaches space. We also need to acknowledge the rGHE idea that every radiative flux inside or from the Earth system is always tied through the very same Stefan-Boltzmann equation to a specific physical temperature. So, for instance, the averaged 240 W/m2 radiative flux from Earth to space is – by mathematical convention – emitted by a temperature blackbody surface at 255K. Even though we know it’s not …
From this, we can quite easily gather, then, how the fundamental premise behind the rGHE hypothesis is simply a ‘Begging the Question’ kind of argument.
Still, this approach allows the defenders of the rGHE hypothesis to look at an EMR spectrum curve for Earth, point to various dips in its outline and claim ‘trapped energy’ and hence warming created below:
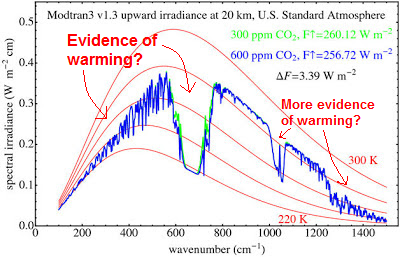
Figure 1.
Even on the face of it, this bears witness to a truly ossified take on reality. They simply cannot for the life of them see beyond the limits of their own simplistic interpretation of this curve: If there are bites, there’s warming!
But, you know what? Hey, let’s actually bear with this remarkably one-dimensional approach to the workings of our climate system for a while. It might just turn out profitable.
Let’s delve into it, see what results we can obtain from it.
Clouds contribute about 25% to the total rGHE on Earth.
Globally averaged. Everybody knows this. Or should know it. It’s a fact, after all. Since 2010 it’s all been quantified and put down in numbers, summed up in a groundbreaking paper by a quartet of jolly and swell ‘climate scientists’, well-known for their thoroughly disinterested and completely unbiased approach to all things climate: Gavin Schmidt, Reto Ruedy, Ron Miller & Andy Lacis, “Attribution of the present-day total greenhouse effect”. From the abstract:
“With a straightforward scheme for allocating overlaps, we find that water vapor is the dominant contributor (∼50% of the effect), followed by clouds (∼25%) and then CO2 with ∼20%. All other absorbers play only minor roles. In a doubled CO2 scenario, this allocation is essentially unchanged, even though the magnitude of the total greenhouse effect is significantly larger than the initial radiative forcing, underscoring the importance of feedbacks from water vapor and clouds to climate sensitivity.”
The bottom line, including overlaps, H2O globally contributes ~75% (three fourths) to the total rGHE, CO2 one fifth. According to Schmidt et al. 2010. With the publication of this paper, the supporters of the rGHE/AGW hypothesis saw their strongly held belief that clouds all by themselves produce a powerful rGHE (one fourth of the total atmospheric one!) authoritatively reinforced.
So, you might ask at this stage, where’s the problem in all this? Doesn’t this actually sound fairly reasonable? Clouds, after all, do impede a significant portion of surface radiation from reaching space, don’t they? They do create a dip in the outgoing EMR spectrum, don’t they? And there is your greenhouse effect (recalling Colose’s definition from upthread).
Yeah, sure, cool. But this is where I start to wonder … What are they actually trying to say? Do they even know themselves?
Because …
What is the “atmospheric radiative greenhouse effect” (rGHE) really supposed to be about? How is it really defined? What is its most essential aspect? Is it really just about impeding outgoing radiation, and that’s it? Isn’t that simply a mechanism? A means to an end? Isn’t the actual effect we’re looking for meant to be something else? The result of the hypothesised mechanism?
Well, it’s in the name itself, isn’t it? A ‘greenhouse effect’. If anything, a greenhouse warms its interior. It creates net warming. Higher mean temperatures. The effect is supposed to make the surface warmer than if it weren’t there. That’s the whole point of it.
The rGHE hypothesis specifically aims at explaining why Earth’s surface is at 288K and not at 255K, why it is 33K warmer than what a pure solar radiative equilibrium could achieve.
We repeat: It is supposed to create net warming. If it doesn’t create net warming, then it’s not a greenhouse effect. And that should of course also go for each separate contributor to the total effect. The effect is in the raising of the mean surface temperature of the Earth above that of the planet’s calculated blackbody emission temperature to space. The 33K is the effect. Everything else just leads up to it. This is its most elemental definition.
So, the following question then naturally arises:
“Does the presence of clouds in Earth’s atmosphere really make the global surface warmer than if they weren’t there?”
We are not looking for a partial effect here. No answer along the lines of saying: “Yes, sometimes.”
We want to know the total, final, steady state net effect of having clouds in our atmosphere on the average global surface temperature.
Not only suggesting, but stating in plain words, that clouds contribute 25% to Earth’s total rGHE (+33K) to me clearly seems to imply a knowledge that the ‘warming’ cloud effect discussed above is (by far) stronger on average than the ‘cooling’ one.
But is this really the case? Or is there a different line of reasoning behind the 25% claim?
It turns out there is.
It turns out that the 25% figure is only arrived at after having excluded the ‘cooling’ part of the cloud effect altogether. In other words, only the ‘warming’ part was ever considered in the first place.
So, are the rGHE proponents seriously considering their effect restricted to whatever mechanism is perceived to create radiative warming (in fact, reduced cooling), at some times during the day or during the year, in some regions of the world, without ever including the opposing effects?
Indeed they are. Openly and unapologetically. Please read on …
The Net Cloud Radiative Effect (net CRE)
According to how the ‘Cloud Radiative Effect’ (CRE) is rationalised inside the specific framework of the rGHE hypothesis (the CRE is clearly a direct product of the thinking behind the rGHE), clouds exert two opposite effects on the surface radiative energy budget (and hence, by extension, on the surface temperature):
- A longwave effect (‘LW cloud radiative effect’, LWCRE) – a cloudy atmospheric column reduces (impedes) total outgoing LWIR to space relative to what that same column, only cloud-free, would; this is simply the Clear Sky ToA radiation minus the All Sky ToA radiation, the latter including clouds. This effect is assumed to be ‘warming’ (from reducing the radiative cooling to space).
- A shortwave effect (‘SW cloud radiative effect’, SWCRE) – clouds reflect a portion of the incoming radiation from the Sun back out into space, much more than clear air, thus reducing the total amount of solar radiative heat to be absorbed by the Earth system. Consequently, this effect is inherently a ‘cooling’ one (reducing the mean heat uptake).
It should be evident from this, that when the rGHE enthusiasts talk about a “greenhouse effect from clouds”, they actually only ever refer to the LWCRE (the longwave effect), ignoring the SWCRE (the shortwave effect), and hence the net cloud radiative effect.
And they do it with a straight face.
The relevant paragraph from the IPCC’s Assessment Report 5 (WG1 (final draft), Chapter 7 “Clouds and Aerosols”, Section 7.2.1.2 (pp 580-2): “Effects of Clouds on the Earth’s Radiation Budget”):
“The effect of clouds on the Earth’s present-day top of the atmosphere (TOA) radiation budget, or cloud radiative effect (CRE), can be inferred from satellite data by comparing upwelling radiation in cloudy and non-cloudy conditions (Ramanathan et al., 1989). By enhancing the planetary albedo, cloudy conditions exert a global and annual short-wave cloud radiative effect (SWCRE) of approximately -50 W/m2 [-47.3 W/m2 according to CERES EBAF Ed2.6r] and, by contributing to the greenhouse effect, exert a mean longwave effect (LWCRE) of approximately +30 W/m2 [+26.2 W/m2 according to CERES EBAF Ed2.6r], with a range of 10% or less between published satellite estimates (Loeb et al., 2009). Some of the apparent LWCRE comes from the enhanced water vapour coinciding with the natural cloud fluctuations used to measure the effect, so the true cloud LWCRE is about 10% smaller (Sohn et al., 2010). The net global mean CRE of approximately -20 W/m2 [-21.1 W/m2 according to CERES EBAF Ed2.6r*] implies a net cooling effect of clouds on the current climate.“
*Same value is given by the most recent Ed2.8.
Watch how they carefully separate between a ‘Greenhouse Effect’ (positive) and an (apparently unrelated) ‘Albedo Effect’ (negative) of clouds, in order to be able to still say that clouds do in fact induce (‘greenhouse’) warming, even when readily conceding that clouds overall cool Earth’s global climate. Chris Colose (in the same post linked to higher up) also reveals this peculiar circumstance seemingly without flinching:
“Finally, claims that water vapor is 95% of the greenhouse effect in our atmosphere is just wrong, and the number cited in the Schmidt et al (2010, still in press) paper is so far the most explicit and detailed partitioning between the various gases/clouds (note that clouds on net cool the planet through albedo, although the study focuses on long wave greenhouse effects).”
Is Colose doing anything but attempt to shrug off the glaring inconsistency forcing itself to the surface here?
Yes, I do realise what he and the IPCC are doing. No need to remind me. I realise that he manages to cover his own behind by letting his argument always stay on the safe side of his own strict definition of the rGHE. What he does is simply remove (ignore) the albedo effect of clouds and keep (‘focus on’) their longwave effect. As is required by the 33K rGHE calculation, which after all is based on the premise that the global cloud cover changes from 60% to 0, but with global albedo not changing at all. A clever move. Because it prevents us from being able to fault him (and the IPCC) when claiming that clouds produce a ‘radiative greenhouse effect’.
We all realise that the distinct rGHE definition relevant to this specific line of argument, is simply the (calculated) outgoing LWIR from the surface minus the (measured) outgoing LWIR from the ToA, and that clouds seemingly do increase this difference by reducing the latter.
But the net result of having a radiatively active atmosphere in the first place, according to the rGHE hypothesis, is not simply a reduction in outgoing radiation from the ToA as compared to the surface. It is an extra warming of the surface, all things considered.
So why bother claiming that clouds contribute positively to the total (warming) greenhouse effect simply because of their longwave CRE (a parameter itself an integral part of the original theoretical rGHE construct), when their net radiative effect is clearly a negative (cooling) one? What’s the point? Where’s the logic? If your goal isn’t for most people to only get half the message, the half that you are touting loudly and incessantly across the land?
Hiding behind the strict, one-sided radiative definition of the rGHE and ‘forgetting’ about the all-important net temperature aspect of it, is, if not downright deceitful, then at least quite artfully devious.
Right. Let’s now finally get down to the meat and potatoes of this post.
I will use a dataset that I’m sure warmists and sceptics alike would approve of: the ‘Clouds and the Earth’s Radiant Energy System – CERES, more specifically, the CERES EBAF Ed2.8.
We’ve already established (and even the IPCC openly approve of this fact) that the net radiative effect of having clouds in our atmosphere (as interpreted within the realm of the rGHE hypothesis) on the global surface energy budget and hence its mean temperature, is significantly negative.
We know this. It’s not a secret. It’s out there. If there were ever any doubt about it, CERES has finally put the question to rest.
The average global net CRE – according to the most recent CERES edition – from March 2000 to June 2014, was quite exactly -21 W/m2:

Figure 2. The annual cycle being exhibited here is somewhat peculiar in that the global net CRE is always less negative in April-May than in December-January by about 11-12 W/m2, and there is generally a narrow lower shoulder during boreal summer. You will be able to see more clearly why this is in Animation 1 and the accompanying Figure 7 further downthread.
According to Stephens et al. 2012, the presence of clouds globally reduces the outgoing LW from the Earth to space by ~26.7 W/m2 (‘LW cloud effect’). At the same time they reflect ~47.5 W/m2 of the incoming SW from the Sun (‘SW cloud effect’).
In other words, clouds radiatively don’t contribute positively to the global surface energy budget (and, hence, its mean temp) at all. Quite the contrary. You need to include both halfs for the cloud effect to make any sense! So, could something produce an overall negative (cooling) surface energy budget and still be causing an (overall warming) “greenhouse effect”? The climate establishment says ‘Well, yes, just forget about that cooling part!!’ (and they want us to go along). I (and Mother Nature) would say ‘Of course not! Don’t be silly!’

Figure 3. From Stephens et al. 2012.
The estimate from Stephens et al. 2012 of a -20.8 W/m2 net ToA radiative cloud effect (global/annual) fits relatively well with the ‘multisensor’ result arrived at by Henderson et al. 2013 (with Stephens as a contributor), who found a similar effect of -18.1 W/m2 (compared with areosols, -1.6 W/m2).
Both results compiled here (pp. 22-26), with an emphasis on the CERES value:
“Overall clouds cool the planet [-21 W/m2]. Almost all of this is realized at the surface.”
Norman Loeb (2014) consolidates this finding, acknowledging that the net effect at the ToA is -20.9 and at the surface -21.3 W/m2 (p. 3).
The takeaway message seems to be: Reduce cloud cover (globally/annually) and what you get is net surface warming.
Or is it …?
I formulated a sort of private rule of thumb from all this: “The net radiative effect of clouds on mean surface temperatures grows more negative the stronger the solar input. Likewise, it grows more positive the weaker the solar input.”
This rule of thumb appears to work perfectly well temporally, that is, clouds clearly have a negative (‘cooling’) effect during the day and a similarly positive (‘warming’) effect during the night. The same pattern is found regarding the seasons – negative in summer, positive in winter.
Based on this rather straightforward relation, I made an assumption that I felt was quite a safe one to make. I assumed that my rule of thumb would also work spatially, that is, the net CRE would be most negative in the tropical zone (where the solar input is at its greatest) and, conversely, most positive in the high-latitude (polar) regions.
This assumption made a lot of sense to me. To the point where I almost started believing it to be true, even before having made any attempt to validate it against real world observations. I tried to justify my certainty like this:
The ‘SW cloud effect’ would be much weaker while the ‘LW cloud effect’ would be only slightly weaker at high latitudes than in the tropics, simply because the incoming SW in the tropics is significantly higher than the outgoing LW, while at high latitudes it is the other way around, only at lower intensities for both:

Figure 4. (Based on ERBE data.)
This led me to the conclusion that the net radiative cloud effect at Earth’s high latitudes (beyond ~45 degrees) should most likely be positive (‘warming’), while in the tropics (below ~30 degrees) it should be negative (‘cooling’). In the transition zone between ~30 and 45 degrees the effect would probably be fairly close to neutral. Since the tropical belt 30N-30S is larger areawise than the two extratropical 90-45 caps put together by about 67%, this alone might explain why the global average radiative cloud effect turns out to be negative. In other words, the magnitude of the extratropical ‘warming’ effect might in itself equal the magnitude of the tropical ‘cooling’ effect; it only covers a considerably smaller area. However, the substantial difference in mean flux intensities (both SW in and LW out), might impact the final situation …
Boy, was I ever wrong …!
As always, reality (through the hard, cold data of empirical observation) trumps any assumption, even assumptions that you feel are based on physically sound reasoning. And when the data proves your assumption wrong, you learn something about how the world works, you change your approach, your ideas, and you move on …
Enter the CERES EBAF Ed2.8 ToA flux dataset.
Yup, it obliterates my above assumption. This is how the global mean net CRE of -21 W/m2 is really distributed from pole to pole:

Figure 5.
There are surely a few things to note here. First, the wide tropics/subtropics band (30N-30S) is completely average, in fact at or above the global mean. This comes as a surprise to me, since it clearly negates the spatial part of my nice little rule of thumb. Even though the solar input is clearly at its strongest globally within this zone, the net CRE is not that impressive. As we shall see, though, it is much more stable and consistently negative than in the extratropics. As would be expected. Because that relates to the temporal aspect.
The extratropics reveal a rather interesting pattern. The midlatitudes are obviously the region on Earth where clouds on average exert the most negative influence on the surface budget. But watch how the net effect in the Southern Hemisphere midlatitudes are so much more negative than in the Northern Hemisphere midlatitudes. That, by the way, also goes for the tropics. Why this difference? It comes down to one thing and one thing only: the ocean/continent ratio. The net CRE happens to be far more negative on average over sea than over land, so whenever the continental percentage goes up, the mean negative influence generally goes down.
What, then, happens north and south of 60 degrees? Well, snow and ice (both seasonal and permanent) enter the equation. And water down the overall cloud albedo effect. As you will observe, the Arctic basin, being mostly an ocean, still doesn’t manage to get above the zero line. The Antarctic continent, however, manages to pull off a slight positive annual mean, all thanks to its dry, cold, perennially shiny white surface.
Annual net CRE is only neutral or weakly positive over the driest areas of the global landmasses, basically nowhere over the oceans. As can be seen here (in (c)):
 Figure 6. (Modified Figure 7.7 (p. 582) from the “Clouds and Aerosols” chapter (AR5, WG1) linked to above.) (a) Shortwave effect (SWCRE), (b) Longwave effect (LWCRE), (c) Net effect (net CRE). It can be deduced from (c) that the desert areas of the northern tropics/subtropics (mostly Sahara+Arabia) are most likely responsible for the entire hump in the net CRE curve at ~10-30 degrees N in Figure 5.
Still, there are huge seasonal variations across the globe:

Animation 1. It is plain to see how the net CRE follows the Sun, back and forth between the hemispheres with the seasons. At any time during the year, there are actually large areas of the world with a positive net CRE. (All yellow and brown hues on the map above signify positive values, all green, blue and purple hues signify negative values.) What you will notice is how, in the winter hemisphere extratropics, the net CRE is always generally positive, while in the summer hemisphere extratropics, it is always generally negative or strongly negative. In these regions, the temporal pattern is clear: The stronger the solar input, the more negative the net CRE, the weaker the solar input, the more positive the net CRE. The net CRE in the tropical/subtropical band (30N-30S) doesn’t vary much, and is basically always firmly negative. The only regions within this band that appear to maintain a positive value throughout the year, are the driest ones, like the Sahara, Arabia and the Atacama Desert. Observe also the interesting circumstance that the net CRE is much more variable over the ocean basins than over the continental land masses. Watch how, in the Northern Hemisphere extratropics, the strongest negative summer values and the corresponding strongest positive winter values are both firmly centred above the northern parts of the Pacific and Atlantic Oceans, while in the Southern Ocean, it is spread out in a wide, circumglobal band, undisturbed by intervening landmasses. This pattern is very likely connected to other important and large-scale climatic variables, like sea level pressure.
The net CRE doesn’t just vary across the Earth’s surface, adding up to a mean global value of -21 W/m2. It also, as you can well gather from Animation 1, varies strongly across the year. Recalling Figure 2, where I pointed out the peculiar annual cycle in global net CRE; well, here is that cycle in global mean net CRE, taken as the average of all years from 2000 to 2014, according to CERES:

Figure 7.
Global net CRE bottoms out at around -27 W/m2 in December-January, during the Antarctic summer, but peaks already in April-May at about -16 W/m2, rather descending again towards and during the Arctic summer. The reason for this is the strengthening countering effect during June-August in the Southern Ocean during its winter season. If the Northern and Southern extratropics net CRE were equally positive and equally negative at their respective peaks, the curve in Figure 7 would rather top out in June-July. But the Antarctic seasonal amplitudes happen to be much larger in either direction:
 Figure 8. Left: net CRE in the Northern extratropics (80-40N); middle: net CRE in the tropics/subtropics (30N-30S); right: net CRE in the Southern extratropics (40-70S). First notice the huge seasonal swings in net CRE north and south of the tropical band, confirming the display in Animation 1 above. In the tropics, there is a mere 8 W/m2 difference between max (May) and min (Oct), while in both the Northern and Southern extratropics, the range in radiative effect is several tens of W/m2. The peak in the North comes in December, while the bottom is reached in June. In the South, the pattern is naturally reversed. But while the Northern extratropics experience a maximum positive net CRE value of about +12 W/m2 during winter and a maximum negative net CRE value of about -60 W/m2 in summer (a total range of 72 W/m2), the Southern extratropics experience a maximum positive net CRE value of about +20 W/m2 during winter and a maximum negative net CRE value of about -100 W/m2 in summer (a total range of 120 W/m2).
Note finally that even in the temperate regions of the world, the generally positive (‘warming’) net ‘cloud radiative effect’ during the winter months is outdone 5 to 1 by the negative (‘cooling’) effect during summer!
That surely is something I didn’t realise …
(And I wouldn’t be surprised if the ratio of the night to day effects turned out to be in the same ballpark. I don’t have data on that, though. But since the diurnal cycle is included in the monthly mean, then …)
In conclusion:
Clouds, according to the rGHE hypothesis and to ‘the climate establishment’, alone make up ~25% of the total “Atmospheric Radiative Greenhouse Effect” on Earth. CO2 allegedly only contribute ~20%. So clouds should warm the Earth’s surface a fair bit more than what CO2 apparently does.
And this would all be correct … within the framework of the rGHE hypothesis itself. Clouds are responsible for one fourth of the postulated 33K elevation in mean global surface temperature above the theoretical pure solar radiative equilibrium temperature, Earth’s planetary blackbody temperature. Because the rGHE is defined only as a LW effect. So the “cloud greenhouse effect” is only meant to include the ‘warming’ LW part of the total (net) “cloud radiative effect” (CRE), which also includes a ‘cooling’ SW part, an effect that happens to be on average much stronger than the ‘warming’ effect. How convenient, then, to just leave it out, simply from defining it away – it would and could not be part of any ‘greenhouse effect’, because a ‘greenhouse effect’ is by definition meant to be a warming one, not a cooling one.
The result being that clouds in our atmosphere, on average, exert a significantly cooling radiative influence on the Earth’s global surface, but still somehow cause a strong (warming) rGHE, in fact, one quarter of the total atmospheric effect. As per the magnificent juggernaut of ‘Climate ScienceTM‘, of course.
Always trust the establishment to be far away from home whenever Reality comes a-knocking, and to do their utmost to bring you along …!
Update: See my comment below on atmospheric (and, hence, also cloud) absorption of incoming solar, which is strangely left out of the CRE equation.
* * *
Meanwhile, back in the real world … In ‘Part 2’ I plan to take a closer look at what’s left of the postulated rGHE. A case study to see whether or not any of it works as told. There clearly is no net radiative warming effect on the surface from having clouds in the sky. So what about the rest? What about the atmosphere at large? Does its radiative properties manage to raise the surface temperature to a higher mean level at all …?
P.S.
If you want to play around with the CERES data yourself, by all means, go ahead! Just remember that the ToA flux datasets are solid, in the sense that they’re the best you could ever hope to find at this current stage, and based on actual measurements (although there are, as in any data-collecting field nowadays, adjustments and calibrations continuously being made*), while the surface flux datasets are highly uncertain and for the most part based on fundamental assumptions, models and calculations. I wouldn’t trust them at all, especially on a regional level …
*“The CERES Energy Balanced and Filled (EBAF) dataset uses an objective constrainment algorithm to adjust SW and LW TOA fluxes within their ranges of uncertainty to remove the inconsistency between average global net TOA flux and heat storage in the Earth-atmosphere system.”


Thank you, my only gripe is the name. Greenhouse effect happen in greenhouses, in glasshouses, in hothouses, but not to planets. But that’s what happens when the lunatics are in charge of the asylum.
[…] The Greenhouse Effect That Wasn’t (Part 1) [How the "greenhouse effect" is by assumption and definition only, not reality.] […]
Interesting additional information (observational data vs. computations) from Tallbloke’s Talkshop:
http://tallbloke.wordpress.com/2014/11/20/insolation-koorin-expedition-and-computing-for-clear-air/
My comment: “The interesting thing is, those infamous global Earth energy budget diagrams do allow for rather substantial atmospheric absorption of incoming solar heat (~70-80 W/m^2), but when for instance estimating the net cloud radiative effect (CRE) on the surface energy budget, this part of the equation is all of a sudden ‘forgotten’ about. So real net CRE would most likely be even way more negative than acknowledged.“
My view with regard to this particular blog is that you are attributing far more thinking ability to climate modellers (the climate establishment) than they are capable of making. They are building models from the ground up, block by block; complex models of the atmosphere and, in more recent times, of the oceans as well. The models divide the globe into discrete spatial blocks with known physical relationships. The models have parameters that are tuned to historical data for the variables within the model to correlate well with observed records. Tuning the models is a complex process.
I am not certain that the modellers would choose to identify anything in the atmosphere that causes warming to be labelled a greenhouse gas but it certainly suits the propagandists in the IPCC to do that.
The models certainly include clouds and the means for varying cloud formation. From what I understand the cloud formation has some sensitivity to CO2 and that sensitivity is one of the tunable parameters within a spatial cell; whether tunable for each cell, a function that has dependence on other variables within the cell or a single parameter across all cells – I do not know the detail of any model.
Spatial albedo and average albedo is an output of the model that can be checked against actual data. Likewise the so-called greenhouse effect can be checked against actual data.
Climate scientists have complete faith in their models. Some of the models are the basis weather forecasts and have been in use for a long time.
The IPCC choose to take the model predictions as being the truth. It is embellished and negative impacts exaggerated.
This comedy clip shows how effective the IPCC has been in selling the global warming message:
It is becoming increasingly apparent that the climate models are no better forecasting the climate 100 years in the future than they are the weather 8 days out. However the blind faith in their extrapolations has already created a mountain of misinformation. In my view no debate on climate change can be settled without discrediting the predictive ability of the models and that requires a better understanding of them. I am only an outside observer piecing together how the models are constructed. One certainty is that they are a simplistic tool when faced with the complexity of Earths climate system.
From my observation, ardent supporters of AGW have limited ability to comprehend the sort of information you are providing. On the other hand it is a good reference for those who are already doubting the AGW theory.