Insolation, Koorin expedition and computing for clear air
Posted: November 20, 2014 by tchannon in atmosphere, Measurement, ozone, radiative theory, Solar physicsA new facility here for creating clear air insolation data, without the more involved absorption effects or cloud, etc. needed some testing and so…
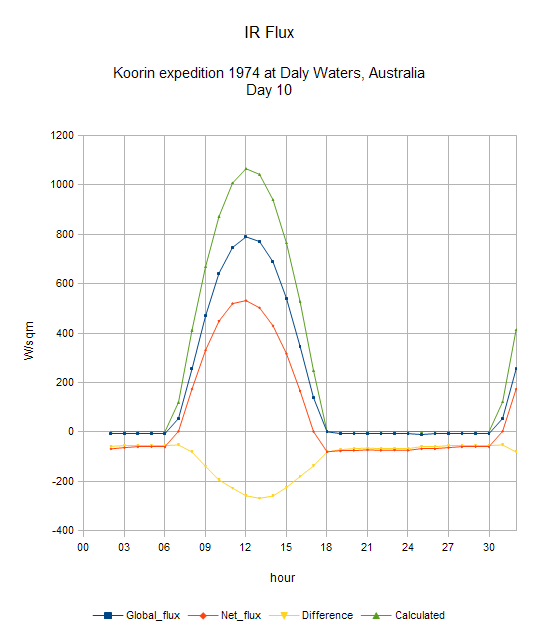
This plot appeared during July 2012[1] after Dr. Hans Jelbring made available hourly data from the Koorin Expedition to Daly Waters, Australia during the astral winter of 1974[2]. A new plot trace has been added, computed by a new dynamic language[3] library, a wrapper around an unaltered version of NREL SOLPOS[4]. This produces an output value for one point in time, the plots here were created by a program feeding in different parameters, producing a time series, all very simple.
This result is similar to a result with data from Chilbolton Observatory, England from a Kip & Zonnen CNR4 net pyranometer / pyrgeometer[5]. Around 22% of inward solar radiation is absorbed by the atmosphere in excess of that computed by SOLPOS.
To compute for the Koorin data I needed where and when. A paper preview “The Koorin Nocturnal Low-Level Jet”, Brook, 1984 [6] provided sufficient, given latitude, longitude and experiment start date. The time zone proved more difficult. Zone is +9.5 but using that produced a data offset, +9.0 looks correct. Not resolved but is sufficient.
No temperature or pressure data is available, default to guessed 25C and 1016mb
Chilbolton

Result on Chilbolton[7] CNR4 in this case using actual meteorological parameters for air temperature and pressure (which have little effect in this instance)
Additional atmosphertic effects
There are copious works attempting to calculate actual surface solar irradiance, none are satisfactory under difficult conditions. Many of these need additional parameters, which are rarely available.
The basic form is a product of terms a * b * c * d .. where for example a is the output of SOLPOS the other terms almost always acting to attenuate the radiation value.
My interest in this particular code apart from availability and apparent excellent performance for what it does, are the side effects, it can also output computed auxiliary values suitable for input for created additional modification factors. Simple example, the exact position of the sun.
An example of a model is MRM where there is a free access paper. This includes discussion of various calculated factors so it is illustrative.
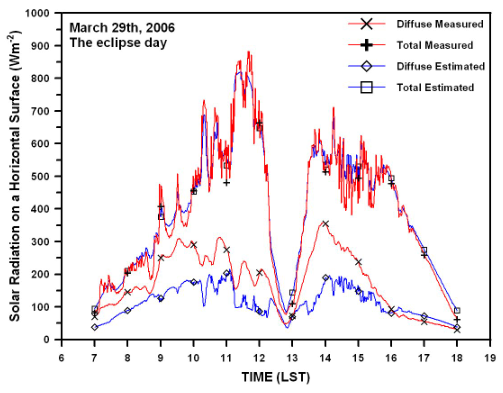
Figure 4b
“Performance of the meteorological radiation model during the solar
eclipse of 29 March 2006”
B. E. Psiloglou and H. D. Kambezidis
Atmospheric Chemistry and Physics journal
Conclusion
None, this is more of an information article perhaps leading to discussion, of what is left to the reader.
1. Original version of plot and context. (link inside Talkshop)
2. Reference to major studies under “Atmospheric Transport and Diffusion Data Archive” here
3. I’m not sure a good definition of a dynamic programming language is possible for a layperson. My words: you can type what to do to a text file and use it immediately, give it to the app(lication) which then figures things out on-the-hoof. It tends to be informal.
This link might help some
4. SOLPOS (SOlar POSsition and intensity)
Online version here
5. CNR4 manufacturers’s site
Talkshop blog item
6. Brook preview.
16 16 S, 133 23 E. Start 15th July 1974, therefore 10th day is 24th July.
http://link.springer.com/article/10.1007/BF00120932#page-1
7. Chilbolton Observatory
Data as netcdf available from BADC
Post by Tim


What happened? That was published with comments disabled but I did nothing to disable them, worse, the setting is hidden from view (I couldn’t even remember where it was). 😦
That’s happened to Oldbrew a couple of times too. Dunno what the cause is. Tick box is under the edit window.
Interesting post Tim. So this estimates insolation at the surface from the position and intensity of the sunlight? Clearsky?
The interesting thing is, those infamous global Earth energy budget diagrams do allow for rather substantial atmospheric absorption of incoming solar heat (~70-80 W/m^2), but when for instance estimating the net cloud radiative effect (CRE) on the surface energy budget, this part of the equation is all of a sudden ‘forgotten’ about. So real net CRE would most likely be even way more negative than acknowledged.
Roger, yes clearsky. As I understand it (not my code) this rather precisely computes sun position in the sky for an exact time and date, and the varying sun/earth distance, and refraction caused by air mass altering the effective sun position. The final result is the heating value taking into account the operational plane in question, which would be horizontal at that location for earth studies but a local tilt can be entered. (hence PV people use this kind of thing and NREL have it)
Valid year range 1950 .. 2050. Other codes handle a wider range. Is partly about exact earth position.
The TSI value is in my opinion slightly wrong (trivial to fixup). The code seems sufficiently accurate for variation to matter. As-if the real problems need better than 5%!
Information, here is dumped library output of all it knows after a computation,, this is for the given solpos test values. Unsorted list, effect of the language used. I have yet to add code to output a few rarely used entities. (shovel them across from C structure to Lua table and compile binary)
azim 97.0333023071
cosinc 0.9125697017
sunset 1181.1102294922
hour 9
timezone -5
zenref 41.590259552
day 22
minute 45
month 7
sunrise 347.174621582
latitude 33.65
prime 1.0370399952
aspect 135
pressure 1006
tilt 33.65
etr 989.6655883789
etrtilt 1207.5485839844
daynum 203
etrn 1323.2398681641
elevref 48.409740448
second 37
amass 1.3357559443
temperature 27
year 1999
retval 0
longitude -84.43
ampress 1.3265256882
unprime 0.9642829299
sbcf 1.2019108534
Test code, output of first two print statement not copied above.
local sol = require('lua_solpos')local dat = {year=1999,month=7,day=22,hour=9,minute=45,second=37,timezone = -5,longitude=-84.43,latitude=33.65,temperature=27,pressure=1006,tilt=33.65,aspect=135}print(sol.getsolar(dat))print(dat.daynum, dat.amass)for i, v in pairs(dat) doprint( i, v)endkristian, yes they do in the flat world physics sense without daily or annual or solar variation, jumble with a common average. Presumably the figures used are correctly computed.
A reader might notice.. it would not be particularly difficult to compute numbers for long lists of say met stations or grid cells. I expect this is published data somewhere for say global.
At the back of my mind are several spots of fun, eg. compute for the Arctic sea over the satellite period, producing a reference of direct solar input. Useful? Only one way to find out.
Talking to myself, looks like I have a fun result for the Chilbolton day in question. On reading some more about what the software libary is doing I took a guess on things I don’t fully understand even with the referenced old paper. This shape corrected then a _linear_ term scales to a match so good it is within the pyraneometer error. Slightly adjusting time leads to very close, noise is starting to limit things.. Looks like a water effect in there, have a lot of other site parameters.
The time thing might be the rough latitude and longitude, instrument not quite straight, no idea.
Put another way, the zero error expensive data logger used at the site is so large it needs compensating. Reads -4W sq/m in darkness. Thermocouple has no output then.
I hope this is more than a fluke.
Postponed some fun posts on other stuff.