NASA has conceded that climate models lack the precision required to make climate projections due to the inability to accurately model clouds.
Clouds have the capacity to dramatically influence climate changes in both radiative longwave (the “greenhouse effect”) and shortwave.
Cloud cover domination in longwave radiation
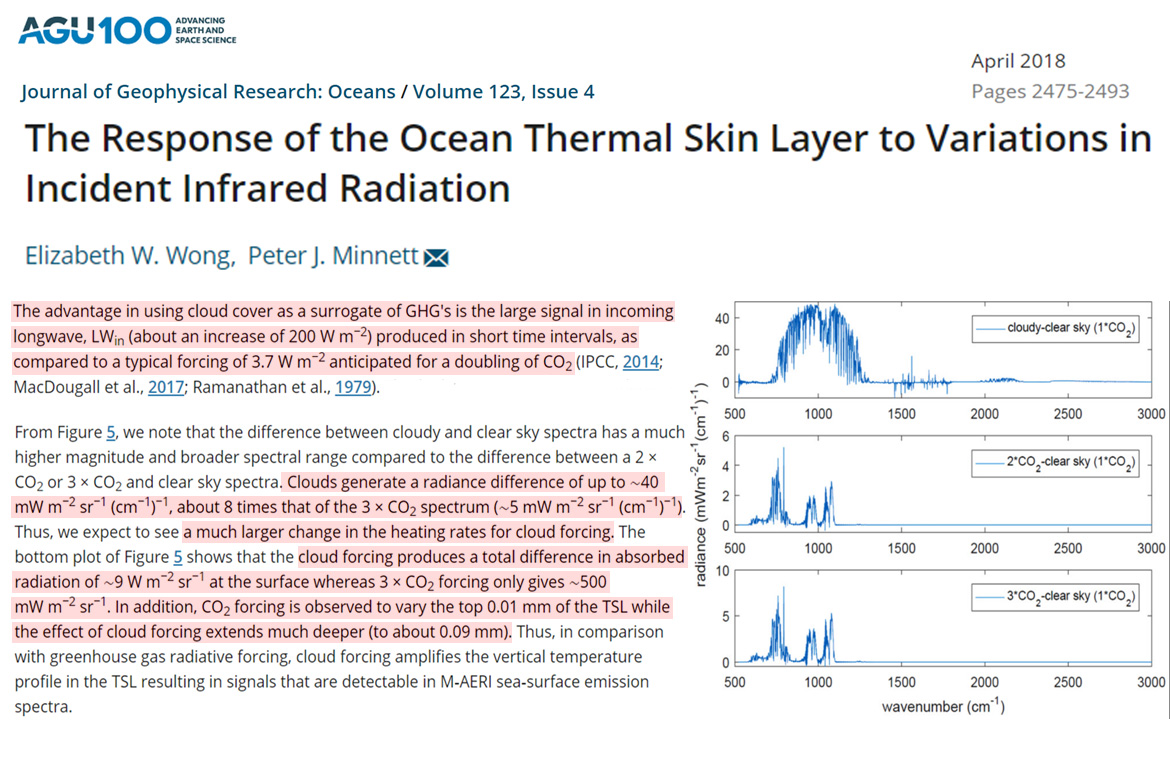
In the longwave, clouds thoroughly dwarf the CO2 climate influence. According to Wong and Minnett (2018):
• The signal in incoming longwave is 200 W/m² for clouds over the course of hours. The signal amounts to 3.7 W/m² for doubled CO2 (560 ppm) after hundreds of years.
• At the ocean surface, clouds generate a radiative signal 8 times greater than tripled CO2 (1120 ppm).
• The absorbed surface radiation for clouds is ~9 W/m². It’s only 0.5 W/m² for tripled CO2 (1120 ppm).
• CO2 can only have an effect on the first 0.01 mm of the ocean. Cloud longwave forcing penetrates 9 times deeper, about 0.09 mm.
In its shortwave albedo capacity, cloud cover modulates the amount of solar radiation that warms the ocean. Changes in the Earth’s radiation budget “are caused by changes in tropical mean cloudiness.” (Wielicki et al., 2002).
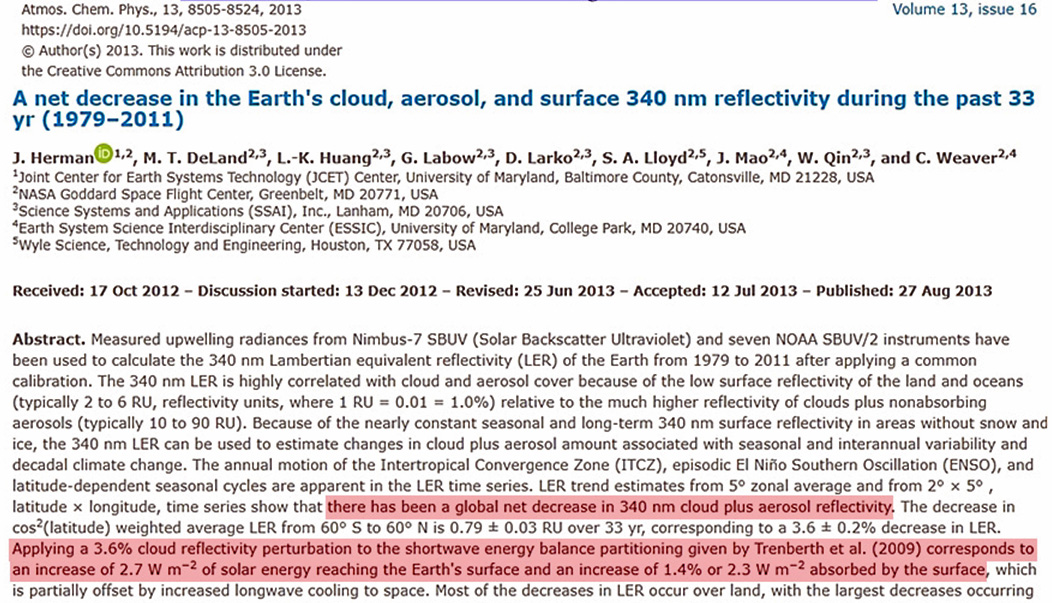
When cloud cover increases, less shortwave radiation reaches the surface, leading to cooling. When cloud cover decreases – as it has since the 1980s – more solar radiation is absorbed.
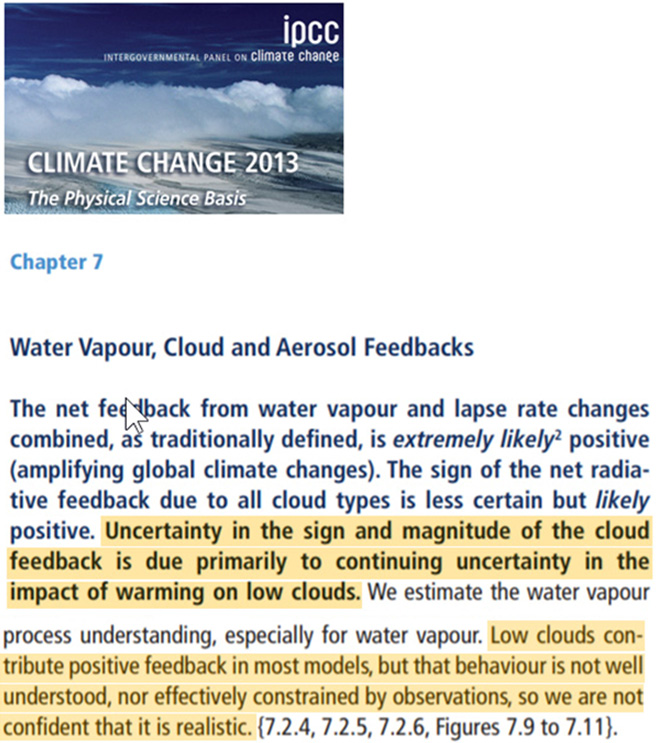
IPCC and NASA acknowledge that we can’t model clouds with requisite accuracy
The IPCC has admitted there is a great deal of “continuing uncertainty” in the sign and magnitude of the cloud influence. Most models indicate a positive feedback (more warming), but this “is not well understood” and the IPCC scientists “are not confident that it is realistic.”
NASA has been even more candid about the massive uncertainties associated with cloud climatology.
Some clouds “cool more than they heat” and other clouds “warm more than they cool.”
In some models “clouds decrease the net greenhouse effect, whereas in others they intensify it.”
Because the uncertainties are so pervasive, NASA concludes that “today’s models must be improved by about a hundredfold in accuracy” if we wish to make climate projections.
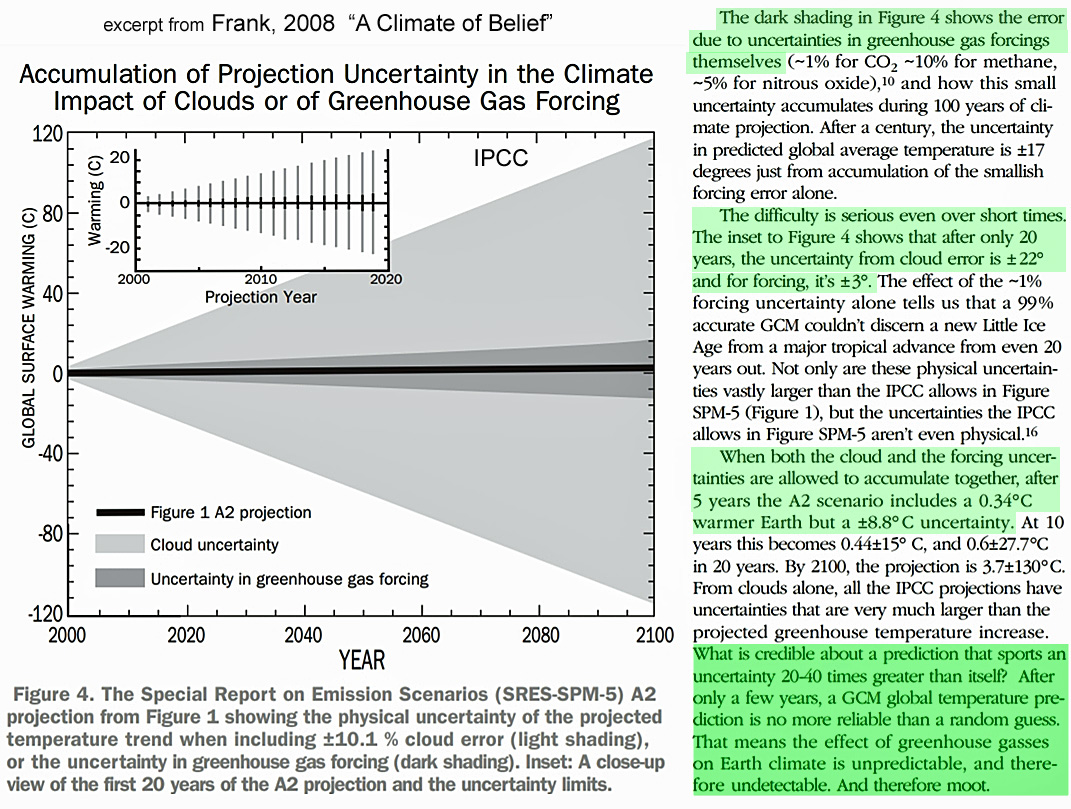
Uncertainty in the effects of cloud forcing are 20-40 times larger than the projected greenhouse gas warming for the next century
Due to the enormous uncertainties associated with cloud cover changes, the IPCC’s CO2 emission scenarios used to calculate warming are reduced to the realm of nearly evidence-free presumption.
Using the IPCC’s emission scenarios, for example, the projected greenhouse gas-induced warming by 2100 is 3.7°C. Due to cloud forcing errors, the uncertainty in this projection is ±130°C!
“When both the cloud and the forcing uncertainties are allowed to accumulate together, after5 years the A2 [greenhouse gas-induced] scenario includes a 0.34°C warmer Earth but a ±8.8°C uncertainty. At 10 years this becomes 0.44±15° C, and 0.6±27.7°C in 20 years. By 2100, the projection is 3.7±130°C.”
Unless we can model clouds, we cannot model climate with any precision
Due to the dominant influence of cloud cover in facilitating climate change, dramatically improving our woefully insufficient capacity to model clouds is both necessary and fundamental.
Climate science should rise to the challenge rather than continuing to gloss over or even dismiss the profound cloud modeling problem undermining climate projections.
Climate modelers admit their models are inadequate in some ways. They claim the next model, or one after that, will soon get it right. Modelers claim they're doing 'simple physics'. So they just need slightly more sophisticated models and the pieces of the climate jigsaw will all fall into place. This is the impression they always give - the solution to life, the universe and climate is just around the corner in the next climate model iteration. Built on the current model of applied "simple physics". Current models are nearly perfect. Future models need become just a little more perfect. Their next grant will allow them to bring it all together and deliver that silver bullet to destroy the bugbear of climate uncertainty. Such is the cosy, rosy world of climate modelers with their greenhouse gas effect models.
Modelers chase grant money. They need to find ever more grant money just to keep their jobs in academia. Grants lead to model tweaks and new papers. New papers must get favourable reviews by the climate establishment. Which explains why the climate modelers are so intellectually conservative. Researchers dare not upset the climate gravy train by developing anything radically new; or they are toast. Think outside the small box of greenhouse-gas-effect establishment dogma and they go from climate hero: solving the climate silver bullet and feeding off the rich bounty of climate science grants to climate denier: grant-less, possibly job-less, and persecuted by the SJW and climate alarmist media. Climate heroes cannot afford to admit to any big doubts in their models or the grants go elsewhere. Modelers are like deluded businessmen, one step away from bankruptcy. To the last moment, they're certain their business will be saved. They're certain their plans are coming together. Just one more loan will save the day. This money chase makes modelers fundamentally dishonest about how science should be done. The failure of climate models is a failure of the scientific community to properly do science, and a failure of scientific funding to understand how good science is done. In their case modelers are, in imagination and rhetoric, just one more grant away from finding the silver bullet to kill the climate uncertainty bugbear.
Models
Back to the models. Climate models are more than just simple physics artfully combined to solve the climate jigsaw puzzle. Modelers make many assumptions about how known physics combine. Many of these assumptions are hidden in the fact they wrote complex, interdependent maths in computer languages. No outsider can read one of these climate programs to see the assumptions gluing the climate physics together. Even if the outsider knows both the totality of existing physics and the computer language in use! The outsider would still need to learn the structure of the climate model, and concerns of the computer program.
The problem with models is not just existing complexity and modelers ignorance about, say, the precise effects of clouds, giving rise to parameterizations in models in place of physics, for example. Nor is it other specific problems identified with existing models. Model assumptions ignore many real-world climate factors such as the host of solar cycles. There are over ten important solar cycles which must be considered in the climate. Solar magnetism are well as insolation changes during cycles. Weaker magnetic fields allow more cosmic rays through to our atmosphere. These cosmic rays cause cascades of atmospheric ionization, each ion may become a nucleuses for cloud formation. These. potentially important. solar forcing moderation effects are ignored by modelers. Many modelers claim scientists studying cosmic ray effects mediated by solar magnetism are 'climate deniers'. Conceit much? This is one example of unknown physics which may one day make a better model, but which is currently ignored as pseudoscience by modelers. I've just been talking about a potential effect mediating some solar cycles. There are over ten solar cycles and potentially more effects.
Models have:
hidden assumptions
many of which are likely right,
others may be wrong and breaking any possible working model,
obsession and faith in a narrow definition of the greenhouse gas effect which is neither a law, hypothesis, nor theory
by implication other interpretations of the greenhouse gas effect are ignored
black-listed physics. (such as various solar cycles); the blacklist enforced by careerism, tribalism, groupthink, politics and grants
potentially still unknown climate effects,
flaws in model construction which can't be discovered while other flaws are present
What is it? Is it a bird, is it a plane, ...
When one makes assumptions about how the world works in science, one speculates and hypothesizes. We're taught that scientific hypotheses become accepted as scientific theory after the hypothesis makes repeatable, predictions about the world. A useful hypothesis is reused because it gives useful results; and is eventually called theory. Useless hypotheses are discarded. No one ever pretends that the hypothesis is true; but scientists eventually act as if an hypothesis is accepted theory and absolutely true. This 3-stage scientific method: "hypothesis -> real world test(s) -> accepted theory, or failed hypothesis" is a cardboard cutout caricature. Used by philosophers of science. It is untrue. It does not work like that.
It ignores the crucial role of induction. Physics was first put together as a set of laws. Laws are basically true inferences about how the world works guided by observation and experiment. We have gas laws, laws of thermodynamics, etc. Each law is a very simple relationship between independent variables; always found to be approximately true. Scientific theories go a step further than laws. Theories explain how and why laws work. When a new hypothesis is proposed it must, sensibly, fit current laws of physics, and current theories. There are already a lot of constraints in place restricting new hypotheses. Namely the entire structure of existing science: currently accepted laws and theories. Scientists often see the development of science as just a tweak to smooth off the rough edges of science. This, kind of, explains the climate modelers' over-confidence in their non-working models. In their heads, they are just a few tweaks away form finding their silver bullet and Nobel prize!
It ignores symmetry or 'beauty'. Much successful science in the last century has been guided by efforts to apply symmetry in science. This has both helped to solve problems and hindered to lead scientists down unsolvable blind alleys (such as the String Theory search for a unified theory of everything).
It ignores the conservatism and groupthink, political constraints of scientists themselves. I already implied black-listed science and a greenhouse gas effect which works only one, politically driven, way. Establishment ideas aim to hype this greenhouse gas effect as a world destroyer unless humanity fixes its errant fossil fuel ways. Alternative explanations of how the greenhouse gas effect works cannot even be considered. Alternatives to the centrality of the greenhouse gas effect are scientific heresy and career suicide.
One ring to bind them all
What really is this greenhouse gas effect? It's The lynchpin upon which models are built, existing policy depends. It is not a law, not a hypothesis, and not a theory. It is a magic construction made from bits and bobs with hidden assumptions. It is political dynamite, and abracadabra. It will make or break careers in: science, policy formation, politics and media. Accept it and you have guaranteed acceptance by the establishment. Reject or criticise greenhouse gas hypotheses then you are a "shill", "denier", or "flat-earth" believer; a heretic to be tortured and burnt in public. To set an example to other potential heretics. This was set in stone, over 30 years ago when the UNFCCC recruited all Environmental NGOs as their propagandists, and shock troops to "stop climate change", "save polar bears" and avert "climate crisis"
The greenhouse gas effect, GHGE is not an accepted theory. It is too useless and unworkable to be that. Nor is it a proper hypothesis because it is nowhere defined. No canonical text explains it, and gives conditions under which it may be falsified. No proposed tests allow us to say whether it works or fails as an actual hypothesis. It may be partly right, and partly wrong at the same time. James Hansen, one of its principle promoters, said scientists who disbelieved it should be imprisoned. Many self-styled liberals and progressives believe imprisonment and persecution of scientific heretics will "save the planet" and "stop climate change" which they think threaten their very existence; their lives. The GHGE is basically Suaron's One Ring, but a dud magic ring; its power all derived from hypnosis, groupthink and belief that magic works.
The scientific establishment made the world like this. On the one hand: the climate model juggernaut, on a never-ending journey to nowhere. Spoon fed money to support establishment neo-Malthusian policy. On the other hand: penniless scientific heretics and unbelievers in search of lost climate science.
Reblog of John L. Daly's "Critique of a paper by Santer et al which became the subject of the IPCC Controversy involving the notorious `Chapter 8' allegations."
A Discernible Human Influence ... by John L. Daly
In a major paper published in the British science journal "Nature" (Vol.382, 4 July 1996, p.39-46) the top players in the Greenhouse Industry (Benjamin Santer of the IPCC, Tom Wigley of NCAR, Philip Jones of CRU,
John Mitchell
of the U.K. Hadley Centre,
A. Oort
and R. Stouffer of GFDL among others) all lent their names to a paper titled "A Search For Human Influences On The Thermal Structure Of The Atmosphere". This paper was trumpeted by the Greenhouse Industry as the final `proof' that Greenhouse was already here, proved not just by models, but also by actual observed data. And it was little surprise that the `observed data' agreed with the models.
They claim to have found the imprint of human influence in observations of upper troposphere temperatures as recorded by sonde balloons, matched these observations with what their model would predict under similar conditions and found the very match they were `searching' for.
This result then inspired the much quoted claim that there was "
...
a discernible human influence on global climate", a remark made in the notorious Chapter 8 of the 1995 IPCC Report, a remark added later to the report after the meeting of drafting scientists in Madrid.
Here's how they found their "discernible human influence ..."
The observed radiosonde record chosen by Santer et al for comparison with the models -
But this is what the whole record looks like -
It's the same data source, except the lower graph shows the full time period available.
Santer et al choose the dates in the upper graph as a basis on which to compare observed conditions against those that the models would predict. Since the models predict upper troposphere warming under enhanced Greenhouse conditions, it was necessary to show that observed data agreed with the models, thus validating those models and proving that the Greenhouse human fingerprint was already evident.
When the full available time period of radiosonde data is shown (Nature, vol.384, 12 Dec 96, p522) we see that the warming indicated in Santer's version is just a product of the dates chosen. The full time period shows little change at all to the data over a longer 38-year time period extending both before Santer et al''s start year, and extending after their end year.
And which version should we trust? The simple rule in all cases like this is -
The longer the time span of a data series, the more reliable is the underlying trend
It was 5 months before `Nature' published two rebuttals from other climate scientists, exposing the faulty science employed by Santer et al. (Vol.384, 12 Dec 1996). The first was from Prof Patrick Michaels and Dr Paul Knappenberger, both of the University of Virginia, who said in part -
"When we examine the period of record used by Santer et al.
(1st graph)
in the context of the longer period available from ref.5
(2nd graph)
, we find that in the region with the most significant warming (30-600S. 850-300 hPa), the increase is largely an artefact of the time period chosen"
The second rebuttal was from a German scientist, Gerd R. Weber, who drew attention to the fact that even the period of warming chosen by Santer et al could itself be explained thus -
"Regarding the role of natural factors, the early years of the period 1963-87 were substantially influenced by tropospheric cooling (and stratospheric warming) following the eruption of Mount Agung, whereas the end of that period was influenced by several strong El Nino events, which have led to some tropospheric warming and stratospheric cooling, particularly in the southern subtropics of the lower latitudes. Therefore the general tropospheric warming and stratospheric cooling trend between 1963 and 1987 has been accentuated by widely known natural factors and could at least partially be explained by them."
In other words, even the warm trend selected out by Santer et al was itself largely explainable by known natural events and not induced through any man-made cause.
So, did Santer et al really discover a "
discernible human influence on global climate
" ? Hardly. The obvious intent inherent in the paper's title, mounting external pressures for some unambiguous sign of human climatic impact, and the choice of a time period which just happened to show a warming phase in an otherwise neutral longer-term record, indicates only that there is today "
a discernible human influence on global climate change science
".
Reblog of interview with Professor Nir Shaviv, removed from Forbes
Against Censorship: The Climate Story Forbes Doesn’t Want You To Read
Date: 09/08/19 | Doron Levin
This is the story journalist Doron Levin wrote for Forbes about the scientific research by Professor Nir Shaviv and Professor Henrik Svensmark, two members of the GWPF’s Academic Advisory Council. The Forbes editor, however, doesn’t seem to like the piece and has therefore removed it from its website. We publish the censored story here for interested readers to make up their own minds about the research by Nir Shaviv and Henrik Svensmark.
Global Warming? An Israeli Astrophysicist Provides Alternative View That Is Not Easy To Reject
The U.S. auto industry and regulators in California and Washington appear deadlocked over stiff Obama-era fuel-efficiency standards that automakers oppose and the Trump administration have vowed to roll back – an initiative that has environmental activists up in arms.
California and four automakers favor compromise, while the Environmental Protection Agency (EPA) supports the president’s position that the federal standards are too strict. The EPA argues that forcing automakers to build more fuel efficient cars will make them less affordable, causing consumers to delay trading older, less efficient vehicles. Complicating matters is California’s authority to create its own air quality standards, which the White House vows to end.
However the impasse is resolved, the moment looks ripe to revisit the root of this multifactorial dustup: namely, the scientific “consensus” that CO2 emissions from vehicles and other sources are pushing the earth to the brink of climate catastrophe.
In a modest office on the campus of Jerusalem’s Hebrew University, an Israeli astrophysicist patiently explains why he is convinced that the near-unanimous judgments of climatologists are misguided. Nir Shaviv, chairman of the university’s physics department, says that his research and that of colleagues, suggests that rising CO2 levels, while hardly insignificant, play only a minor role compared to the influence of the sun and cosmic radiation on the earth’s climate.
“Global warming clearly is a problem, though not in the catastrophic terms of Al Gore’s movies or environmental alarmists,” said Shaviv. “Climate change has existed forever and is unlikely to go away. But CO2 emissions don’t play the major role. Periodic solar activity does.”
Shaviv, 47, fully comprehends that his scientific conclusions constitute a glaring rebuttal to the widely-quoted surveys showing that 97% of climate scientists agree that human activity – the combustion of fossil fuels – constitutes the principle reason for climate change.
“Only people who don’t understand science take the 97% statistic seriously,” he said. “Survey results depend on who you ask, who answers and how the questions are worded. In any case, science is not a democracy. Even if 100% of scientists believe something, one person with good evidence can still be right.”
History is replete with lone voices toppling scientific orthodoxies. Astronomers deemed Pluto the ninth planet – until they changed their minds. Geologists once regarded tectonic plate theory, the movement of continents, as nonsense. Medical science was 100% certain that stomach ulcers resulted from stress and spicy food, until an Australian researcher proved bacteria the culprit and won a Nobel Prize for his efforts.
Lest anyone dismiss Shaviv on the basis of his scientific credentials or supposed political agenda, consider the following: He enrolled at Israel’s Technion University – the country’s equivalent of MIT – at the age of 13 and earned an MA while serving in the Israel Defense Force’s celebrated 8200 Intelligence unit. He returned to Technion, where he earned his doctorate, afterward completing post-doctoral work at California Institute of Technology and the Canadian Institute for Theoretical Astrophysics. He also has been an Einstein Fellow at The Institute for Advanced Study in Princeton.
In other words, he knows tons more about science than Donald Trump or Al Gore.
As for politics “in American terms, I would describe myself as liberal on most domestic issues, somewhat hawkish on security,” he said. Nonetheless, the Trump administration’s position on global climate change, he said, is correct insofar as it rejects the orthodoxy of the United Nations Intergovernmental Panel on Climate Change (IPCC). The IPCC’s findings and conclusions are updated every six years; the latest report, released this week, noted that deforestation and agribusiness are contributing to CO2 emissions and aggravating climate change.
In 2003, Shaviv and research partner Prof. Jan Veizer published a paper on the subject of climate sensitivity, namely how much the earth’s average temperature would be expected to change if the amount of CO2 in the atmosphere is doubled. Comparing geological records and temperature, the team came up with a projected change of 1.0 to 1.5 degrees Celsius – much less than the 1.5 to 4.5 degree change the IPCC has used since it began issuing its reports. The reason for the much wider variation used by the IPCC, he said, was that they relied almost entirely on simulations and no one knew how to quantify the effect of clouds – which affects how much radiant energy reaches the earth – and other factors.
“Since then, literally billions have been spent on climate research,” he said. Yet “the conventional wisdom hasn’t changed. The proponents of man-made climate change still ignore the effect of the sun on the earth’s climate, which overturns our understanding of twentieth-century climate change.”
He explained:
“Solar activity varies over time. A major variation is roughly eleven years or more, which clearly affects climate. This principle has been generally known – but in 2008 I was able to quantify it by using sea level data. When the sun is more active, there is a rise in sea level here on earth. Higher temperature makes water expand. When the sun is less active, temperature goes down and the sea level falls – the correlation is as clear as day.
“Based on the increase of solar activity during the twentieth century, it should account for between half to two-thirds of all climate change,” he said. “That, in turn, implies that climate sensitivity to CO2 should be about 1.0 degree when the amount of CO2 doubles.”
The link between solar activity and the heating and cooling of the earth is indirect, he explained. Cosmic rays entering the earth’s atmosphere from the explosive death of massive stars across the universe play a significant role in the formation of so-called cloud condensation nuclei needed for the formation of clouds. When the sun is more active, solar wind reduces the rate of cosmic rays entering the atmosphere. A more active solar wind leads to fewer cloud formation nuclei, producing clouds that are less white and less reflective, thus warming the earth.
“Today we can demonstrate and prove the sun’s effect on climate based on a wide range of evidence, from fossils that are hundreds of millions of years old to buoy readings to satellite altimetry data from the past few decades,” he said. “We also can reproduce and mimic atmospheric conditions in the laboratory to confirm the evidence.
“All of it shows the same thing, the bulk of climate change is caused by the sun via its impact on atmospheric charge,” he said. “Which means that most of the warming comes from nature, whereas a doubling of the amount of CO2 raises temperature by only 1.0 to 1.5 degrees. A freshman physics student can see this.”
Nevertheless, the world of climate science has “mostly ignored” his research findings. “Of course, I’m frustrated,” he said. “Our findings are very inconvenient for conventional wisdom” as summarized by the IPCC. “We know that there have been very large variations of climate in the past that have little to do with the burning of fossil fuels. A thousand years ago the earth was as warm as it is today. During the Little Ice Age three hundred years ago the River Thames froze more often. In the first and second IPCC reports these events were mentioned. In 2001 they disappeared. Suddenly no mention of natural warming, no Little Ice Age. The climate of the last millennium was presented as basically fixed until the twentieth century. This is a kind of Orwellian cherry-picking to fit a pre-determined narrative.”
Shaviv says that he has accepted no financial support for his research by the fossil fuel industry. Experiments in Denmark with Prof. Henrik Svensmark and others to demonstrate the effect of cosmic rays on cloud formation were supported by the Carlsberg Foundation. In the U.S. the conservative Heartland Institute and the European Institute for Climate and Energy have invited him to speak, covering travel expenses.
“The real problem is funding from funding agencies like the National Science Foundation because these proposals have to undergo review by people in a community that ostracizes us,” he said, because of his non-conventional viewpoint.
“Global warming is not a purely scientific issue any more,” he said. “It has repercussions for society. It has also taken on a moralistic, almost religious quality. If you believe what everyone believes, you are a good person. If you don’t, you are a bad person. Who wants to be a sinner?”
Any scientist who rejects the UN’s IPCC report, as he does, will have trouble finding work, receiving research grants or publishing, he said.
In Shaviv’s view, the worldwide crusade to limit and eventually ban the use of fossil fuels isn’t just misguided “it comes with real world social and economic consequences.” Switching to more costly energy sources, for example, will drive industry from more industrialized countries to poorer countries that can less afford wind turbines and solar panels.
“It may be a financial sacrifice the rich are willing to make,” he said. “Even in developed countries the pressure to forego fossil fuel puts poor people in danger of freezing during the winter for lack of affordable home heating. The economic growth of third world countries will be inhibited if they cannot borrow from the World Bank to develop cheap fossil-based power plants. These are serious human problems in the here and now, not in a theoretical future.”
For Shaviv, the rejection and closed-mindedness his minority view provoke may contain a silver lining. Just think of the acclaim that awaits if his research — and scientific reconsideration of the current orthodoxy — one day proves persuasive.
I had to do a double take there too. She really does mean it. Sophie Lewis called computer models such as General Circulation Models, GCMs 'methods'. She believes these GCMs discover facts about the world! She is not left-field either. A recent climatology textbook I read described computer model runs as experiments.
Q: What ideas go into the programs making GCMs? A: In a sense the GCMs are cherry-picked physics working in a particular way to describe the climate; built using some established Scientific Theories. That is why the self-styled climate consensus call their climate models and ideas 'simple physics'.
But I would call a GCM a hypothesis (and not a scientific one either). Because the way it assembles physics theories was never tested against the real world. GCMs have no falsifiability criteria either. So modeling has become a new way to pretend to do science. All the while claiming to be doing 'settled science'.
Q: What do mainstream scientists mean by the term 'settled science'? A: 'settled science' is science developed by framing testable hypotheses (that is: by establishing falsifiability rules for hypotheses) then validating those hypotheses experimentally or observationally such that no facts contradict the hypotheses. Hypotheses which pass their falsifiability criteria are then called Scientific Theories, or 'settled science'.
The terminology of 'settled science' in climatology is just a ruse for doing pseudoscience, or fake science (AKA GCMs and climate models). But getting paid for it while avoiding critics. All the while, calling your critics climate deniers, shills and flat-earth believers. Explaining to other climate scientists, observing and experimenting that their science is wrong in some way when their facts contradict your models.
A scientific hypothesis must be framed with falsifiability criteria. Otherwise it's just speculation because:
The scientific worldview began 2600 years ago in Ionia on the Aegean shore when Thales, followed by Anaximander, began their systematic projects to explain the world in terms of things, of this world. They were no longer prepared to let story-tellers, and religious leaders dominate the narrative with tales of Gods and nature spirits moving the stars. How did it go? The Greeks made some quick gains leading to ancient Greek science, then it got stuck. Western civilization went two millennia with precious little scientific progress. Then just over 400 years ago a few practical people like Galileo began a new way of science. They falsified many establishment laws of nature, by experimentally showing how things really worked. Ideas of Aristotle and Ptolemy, so-called natural law were refuted with facts. This scientific revolution gave us our modern world, with magnificent advances in technology, life-span, health, welfare, education, wealth, travel. Civilization everywhere on earth is now predicated on a scientific model explained best by the likes of Popper and Feynman. They propose a model of how science is best done, based on how science best advanced.
You can say you have another 'model of science' but nothing shows your model will work. The 16th century scientific revolution led by the likes of Galileo worked because it created a model for scientific discovery leading to certain understanding. Advanced speculation does not work. For example: millions of person-hours spent "advancing" String Theory gave us nothing of material value; because the speculatively made hypotheses of String Theory were not falsifiable, and there are billions of possible String Theories.
That's just one example of how science goes wrong. There are many ways to break science whilst pretending to do it. Bad statistics is another way. Most published science is false. Science does not need post-normal science, and bad modeling to invent new ways to get things wrong. We already know there is only one route to do working science. The route explained by Popper and Feynman. The route taken by scientists who actually discover and invent useful technologies.
It pains me that our universities produce so many scientists ignorant about the basics of what their their craft should be.
Data from all reporting agencies agree that at least as far back as 2002 average global temperature tracks water vapor, not CO2 (Figure 0.2). Hat-tip: Dan Pangburn.
Atlantic ocean cycles, AMO, and land surface temperature in the Eastern USA show delayed correlation:
They concluded: Responses of sea-surface temperature to solar wind speed on the seasonal
timescale have been found, and in the North Atlantic region in winter they resemble
the North Atlantic Oscillation. At the locations of the peak (negative) response in the
North Atlantic the SST decreases by approximately 1°C for 100 km s-1
increase in solar wind speed. In the southern hemisphere regions of significant positive and
negative correlations with SWS are smaller and less well organized. The analysis is
made for 1963-2010 data, and the effect strongest in winter, and greater when the
solar wind magnetic field is southward, ensuring greater energy input into the
ionosphere-atmosphere system. The response is somewhat stronger in the west phase
of the QBO than in the east phase, and stronger than when F10.7 is used for the
correlations. These seasonal responses are consistent with cumulative effects of a
prompt electrical mechanism affecting cloud microphysics, as found
elsewhere. However, on the seasonal timescale there is ambiguity as to which of
several inputs to the stratosphere or troposphere is driving the responses. It is even
possible that upward propagating waves, resulting from short term responses to the
solar wind, are changing the strengths of the northern and southern polar vortices,
which on longer timescales cause downward propagating dynamical disturbances that
affect the NAO and the southern oceans.
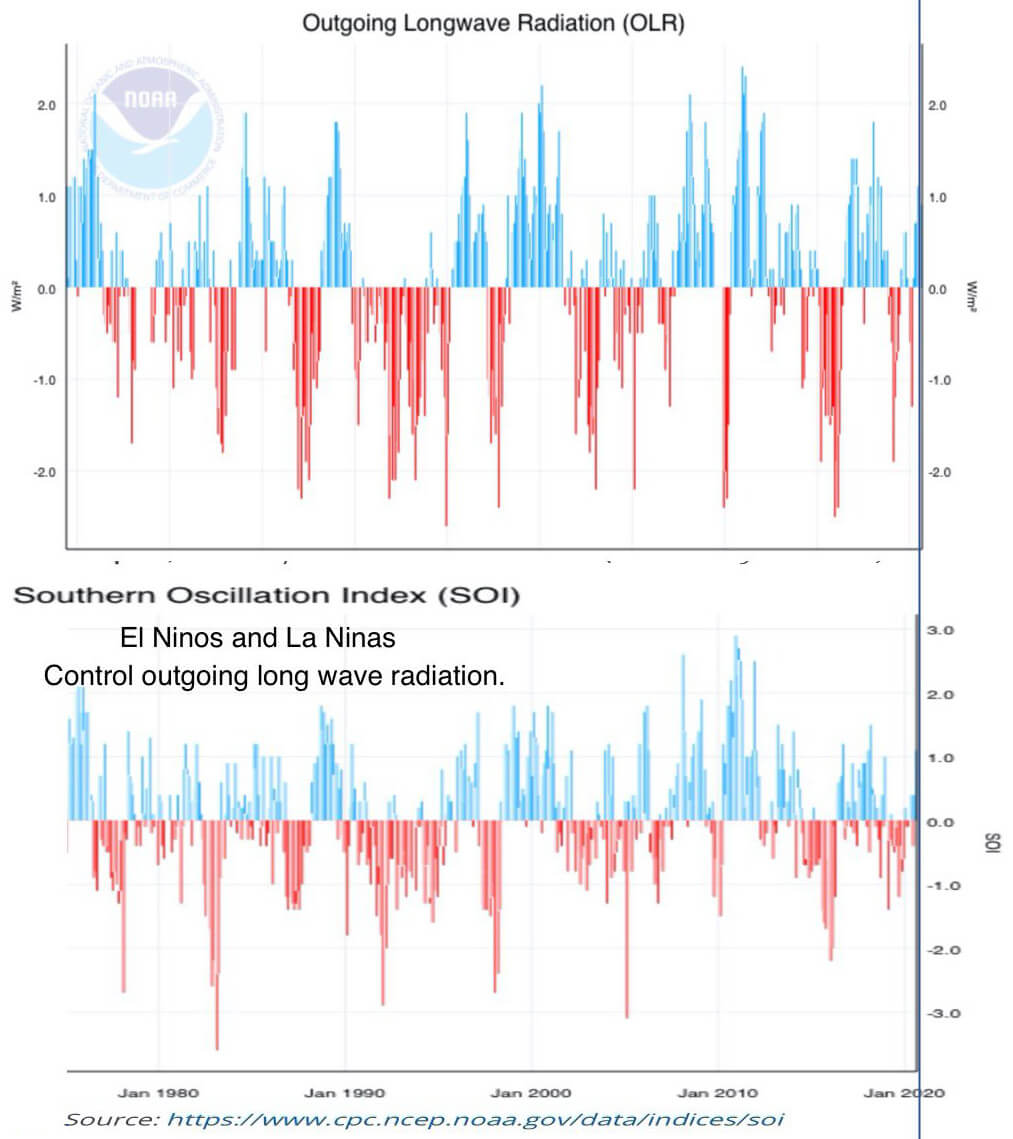
Over the pacific: Outgoing longwave radiation to space correlates with ocean cycles:
Solar cycles significantly affect seismic activity.
Volvanoes and earthquakes happen at seismic fault lines where tectonic plates overlap.
"In this paper, we analyze 20 years of proton density and velocity data, as recorded by the SOHO satellite, and the worldwide seismicity in the corresponding period, as reported by the ISC-GEM catalogue. We found clear correlation between proton density and the occurrence of large earthquakes (M> 5.6), with a time shift of one day.The signifcance of such correlation is very high, with with probability to be wrong lower than 10-5 " [meaning one in 10000] ...In this paper, we demonstrate that it [the correlation] can likely be due to the effect of solar wind, modulating the proton density and hence the electrical potential between the ionosphere and the Earth ... our hypothesis only implies that the proton density would act as a further, small trigger to cause the fracture on already critically charged faults, thus producing the observed large scale earthquake correlation."
Marchitelli et al only claim an fingerprint between seismicity and solar wind proton density. Increased seismicity leads to both volcanos and earthquakes. Only earthquakes were used in the data because there are tens of thousands per year; leading to excellent statistical certainty. in contrast there are about 25+ new volcanoes each year; too few to give good statistical certainty.
Precipitation vs. Sunspot numbers. February precipitation in Germany compared to changes in sunspots. Shown is the optimum positive correlation (r = 0.54) with a solar lag of +17 months. Solar cycles are numbered 14–24. The probability that the correlation r = 0.54 is by chance is less than 0.1% (p < 0.001). Source: NoTricksZoneAbstract
Correlation of specific humidity and Sunspot Numbers within Schwabe cycles (smoothed over 100 months) 1940 to 2010, around 30,000 feet (tropopause). Sun spot count: green. Source Tallbloke blog: solar system dynamics: August 8, 2010. Humidity changes are "totally overwhelmed by a much more powerful forcing, i.e. the Sun. I discovered this years ago looking at NCEP reanalysis data. Sunspots averaged over 8 years in green compared with 300mb specific humidity data in brown." -- Rog Tallbloke
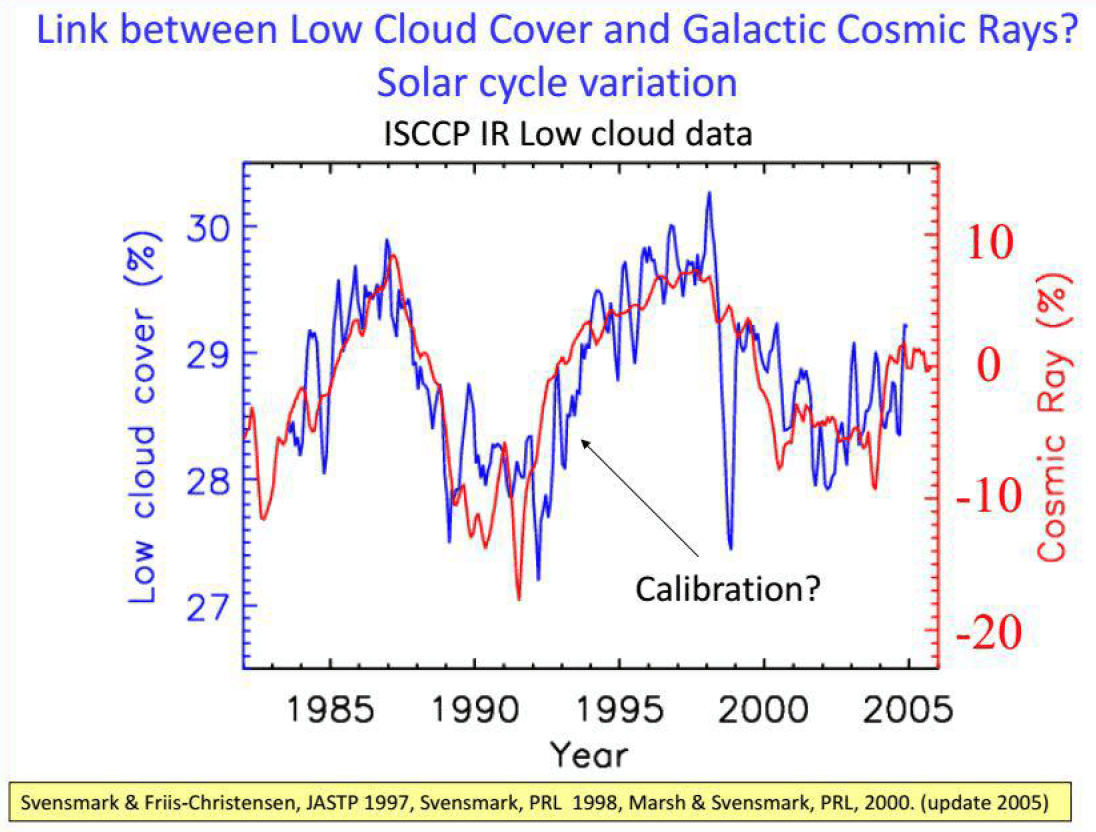
The graph below is from a presentation in March 2018 by Henrik & Jacob Svensmark. It shows the strong connection over a 30 year period between cosmic ray variations, as modulated by the non-radiant features of solar activity [NRSA], and their effect on the level of cover from low clouds. This is able to explain NRSA's link with temperature on timescales of days to decades.
This controlling role of the NRSA is crucial to the theory of the solar factor because major variation in total solar radiant heat output - RHO - is slow and therefore only able to account for climate changes on timescales from about 50 years upwards.
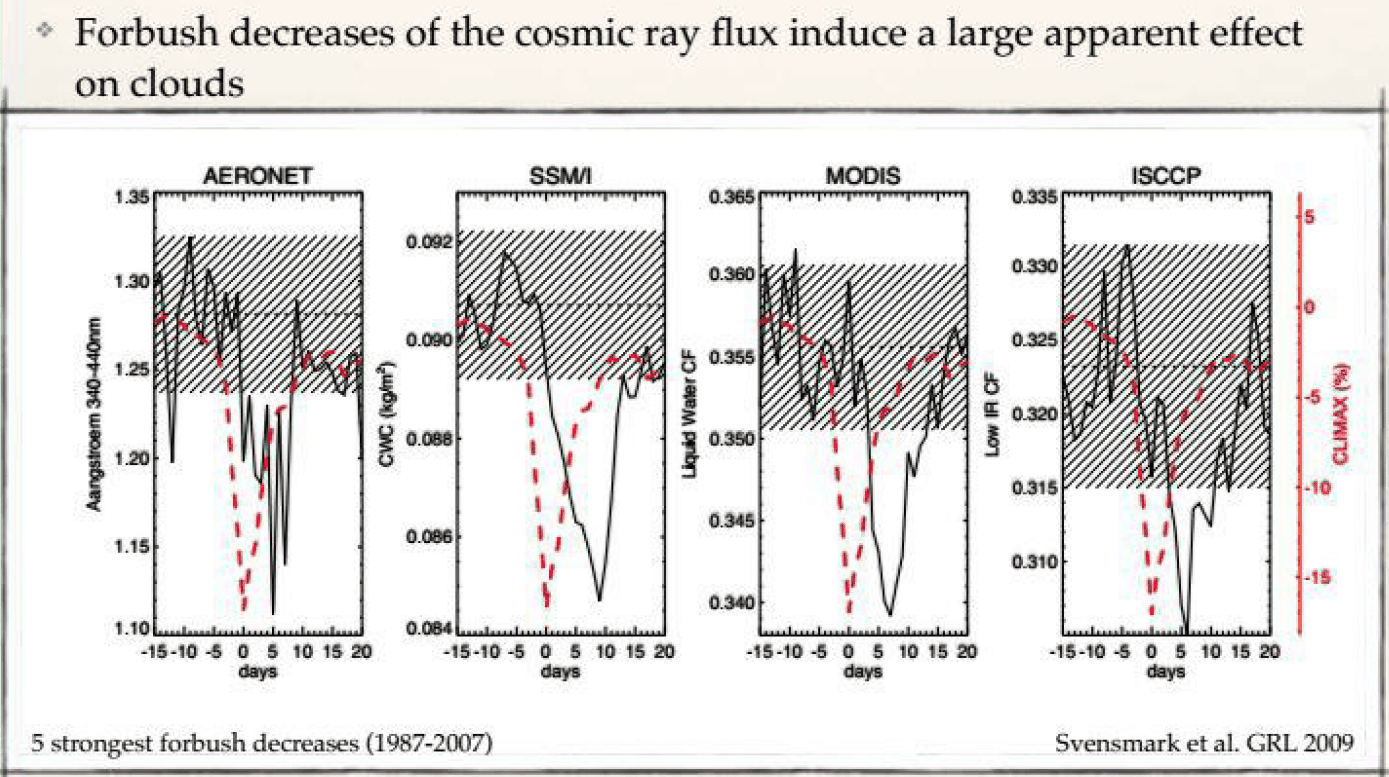
Clinching evidence for the link between variation in cosmic ray flux and the level of cloudiness comes from sudden and and short term decreases in this flux - known as
Forbush decreases [see note below] - and their apparent effect on cloudiness within days, as shown by in the diagrams below
Note on Forbush decreases. These arise from sudden and short term changes to the magnetic field of the solar plasma wind, which follow from ejections of material by the sun known as coronal mass ejecrions [CME's] - see Wikipedia for details
Rapid AMO warming from the mid 1990’s is covariant with:
A decline in low cloud cover globally, leading to surface warming, and increased upper ocean heat content.
Changes in the vertical distribution of water vapour: Declines in lower stratosphere water vapour leading to cooling. Increases in low-mid troposphere water vapour, at least due to higher SST’s coupled with an increase in surface wind speeds over the oceans, leading to low-mid troposphere warming.
Reduced CO2 uptake in the warmer North Atlantic and in land regions made drier by the warm AMO phase (and increased El Nino).
All because ocean phases vary inversely to changes in climate forcing.
Blue = C-14 proxy for solar activity Black = sea floor record for N Atlantic proxy for temperature
Hat tip: Nir Shaviv, via this paper: Persistent Solar Influence on North Atlantic Climate During the Holocene, Bond et al, Science 294 | 7 Dec 2001
Shaviv: Correlation between the cosmic ray flux reconstruction (based on the exposure ages of Iron meteorites) and the geochemically reconstructed tropical temperature. The comparison between the two reconstructions reveals the dominant role of cosmic rays and the galactic “geography” as a climate driver over geological time scales. Figure 2 (below):
The cosmic ray flux (Φ) and tropical temperature anomaly (ΔT) variations over the Phanerozoic. The upper curves describe the reconstructed CRF using iron meteorite exposure age data (Shaviv, 2002b). The blue line depicts the nominal CRF, while the yellow shading delineates the allowed error range. The two dashed curves are additional CRF reconstructions that fit within the acceptable range (together with the blue line, these three curves denote the three CRF reconstructions used in the model simulations). The red curve describes the nominal CRF reconstruction after its period was fine tuned to best fit the low-latitude temperature anomaly (i.e., it is the “blue” reconstruction, after the exact CRF periodicity was fine tuned, within the CRF reconstruction error). The bottom black curve depicts the 10/50 m.y. (see Fig. 1) smoothed temperature anomaly (ΔT) from Veizer et al. (2000). The red line is the predicted ΔTmodel for the red curve above, taking into account also the secular long-term linear contribution (term B × t in equation 1). The green line is the residual. The largest residual is at 250 m.y. B.P., where only a few measurements of δ18O exist due to the dearth of fossils subsequent to the largest extinction event in Earth history. The top blue bars are as in Figure 1.
300 years of Chinese spruce compared with sunspot counts averaged over the solar cycle length (blue). Hat tip Rog Tallbloke
Precipitation Climate and Solar modulation of the last 1000 years.Blue: Reconstructed Temperature Storch et al 2004, Red: solar modulation, after Muscheler et al 2007, Black: Reconstruction of precipitation amounts for the edge of the Tibetan Plateau. Sun & Liu (2012).
Global temperature anomaly is inversely proportional to specific humidity.
Both the East Asia Summer Monsoon and the Northern Australia Summer Monsoon retreated synchronously during the recent cold Little Ice Age in response to external forcings such as solar irradiance variation and possibly large volcanic eruptions.
Fingerprints of the Sun on Asia-Australia Summer Monsoon Rainfalls during the Little Ice Age, Hong Yan, Willie Soon, & Bob Carter:
The following graph shows the recorded and predicted temperatures as plotted by Ole Humlum et al from their 2011 paper: “Identifying natural contributions to late Holocene climate change” (Elsevier); O. Humlum et al. / Global and Planetary Change 79 (2011 Central Greenland (GISP2) surface temperature of the past 4,000 years (blue line). Natural cycle modelled and forecasted data are shown by the green line. The coefficient of determination (r2) for the hindcasting period is 0.63.)
“The causes of long (millennial scale) climate changes are generally poorly understood, and the issue is important for understanding the natural climate variability, as illustrated by ice and ocean cores. Also, the lack of a CO2 cycle at millennial time scales underscores the independence of such long climate variability from anthropogenic greenhouse enhancement.”
“The warming following the Little Ice Age is generally perceived as a natural recovery from the previously cold period, and the effect of anthropogenic greenhouse enhancement is assumed to become important only after 1975 (IPCC, 2007). Our simple cyclic model (Fig.) is able to forecast the main features of this recorded warming until 2010, underlining that a significant part of the 20th century warming may be interpreted as the result of natural climatic variations, known to characterise at least the previous 4000 years.”
This blog began when I copied a comment by Ulric Lyons (listing 3 fingerprints of natural climate variability) from Judith Curries blog. | March 4, 2019 at 9:45 am.
I expanded it by adding more fingerprints.
A climate fingerprint can be recognized as a relationship (correlation) between two, or more, variables. When these two things change at the same time, on multiple occasions, in the same, or opposite directions then we have an excellent 'fingerprint'.
IMHO, fingerprints and lack of them where they're expected are the best, and simplest, climate evidence. Because fingerprints are simple and obvious evidence. We can all understand them and most likely agree on them when the data and statistics are honest.
When found in nature, fingerprints can be used as evidence in both validation and falsification of hypotheses.
I searched for 'fingerprint' at WUWT. Most of the articles here are about fingerprint claims made, or expected fingerprints not found. I think we should balance that with fingerprints actually found. We should put more emphasis on showing what the science IS, rather than just commenting on what other people think the fake science is, and why they are wrong.