Thursday, 4 January 2024

Climate Change Causes - Best evidence.

Summary

  1. Recent climate changes are due to the reinforcement of 2 solar-related osciallations; often called the Bray (or Hallstatt) and the Eddy cycles. The Bray is likely about 2318 years [1], and the Eddy about 1000 years.
  2. But how? The mechanism by which changes in climate cycles affect surface temperatures is disputed, as is the surface temperature change. The best evidence I've seen comes for Joe Bastardi. He is weather forecaster. So we can completely trust his data as he must use the best data to forecast the weather. Bastardi's basic argument is that the ultimate cause of current climate changes are changes in seizmic activity.
  3. Solar cycles significantly affect seismic activity.

    Volvanoes and earthquakes happen at seismic fault lines where tectonic plates overlap.

    "In this paper, we analyze 20 years of proton density and velocity data, as recorded by the SOHO satellite, and the worldwide seismicity in the corresponding period, as reported by the ISC-GEM catalogue. We found clear correlation between proton density and the occurrence of large earthquakes (M> 5.6), with a time shift of one day. The signifcance of such correlation is very high, with with probability to be wrong lower than 10-5 " [meaning one in 10000] ... In this paper, we demonstrate that it [the correlation] can likely be due to the effect of solar wind, modulating the proton density and hence the electrical potential between the ionosphere and the Earth ... our hypothesis only implies that the proton density would act as a further, small trigger to cause the fracture on already critically charged faults, thus producing the observed large scale earthquake correlation."

    Marchitelli et al only claim an fingerprint between seismicity and solar wind proton density. Increased seismicity leads to both volcanos and earthquakes. Only earthquakes were used in the data because there are tens of thousands per year; leading to excellent statistical certainty. in contrast there are about 25+ new volcanoes each year; too few to give good statistical certainty.

    Links: Salon | Nature (paper, open access)

  4. How does seizmic activity affect climate?

    Massive volcanic erruptions can eject ash into the stratosphere which increases earth's albedo and reflects sunlight away. But that is not, generally what happens. Bastardi believes that this increased seizmic activity is associated with changes in tropospheric water vapour content; which ultimately causes warming
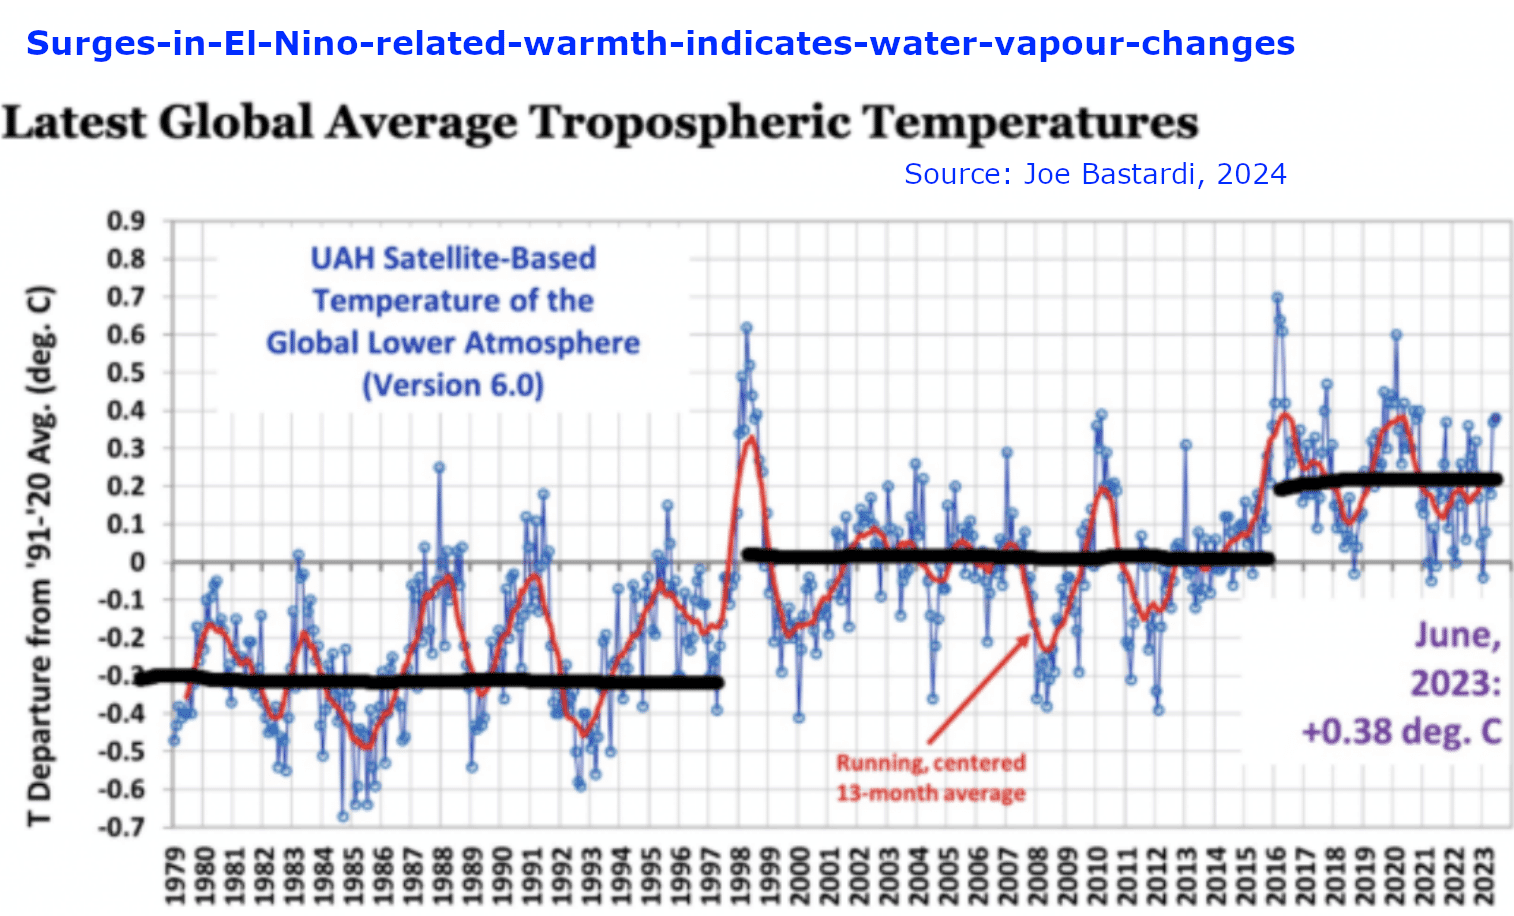
  5. Warming is mainly in the Arctic

  6. It may be that these seizmic activity changes are merely coincidental. Climate warming can also be due to less cloud cover over the sky. Clouds reflect sunlight out to space. Fewer clouds let in more sunlight.
  7. From 1996, Henrik Svensmark / Eigil Friis Christensen first show how cosmic rays control cloud cover.
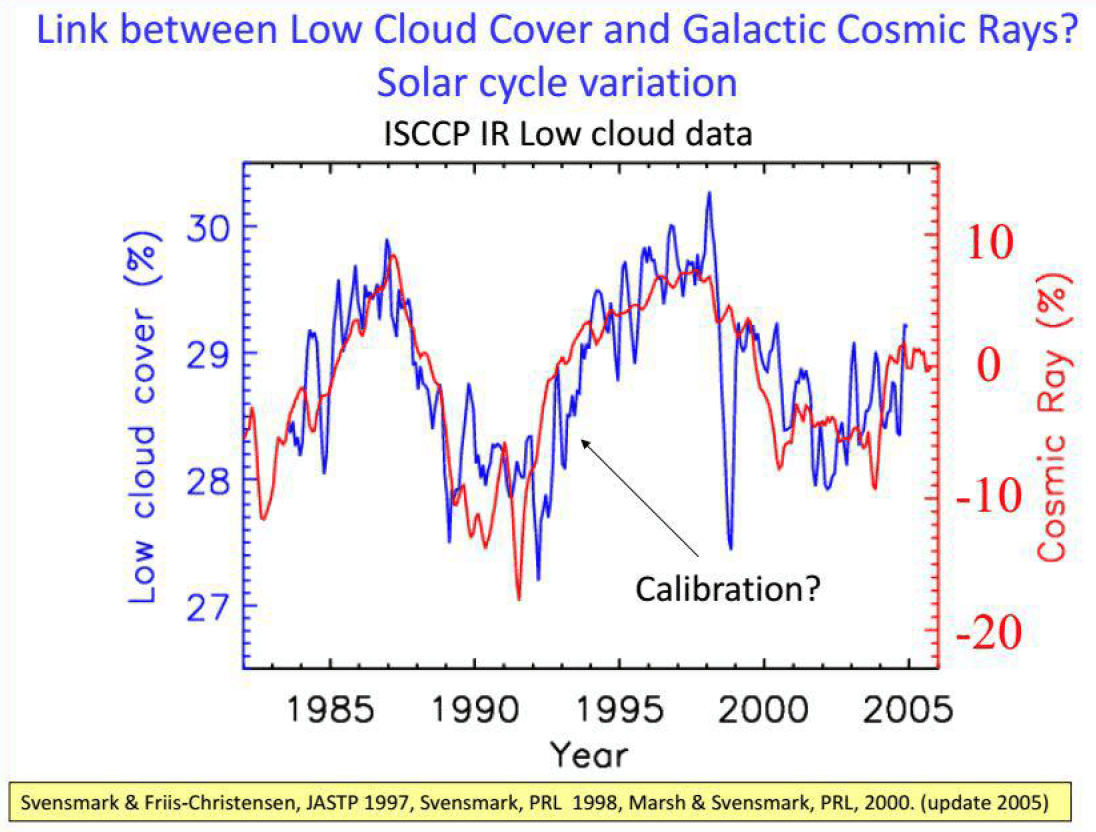
    1. The graph below is from a presentation in March 2018 by Henrik & Jacob Svensmark. It shows the strong connection over a 30 year period between cosmic ray variations, as modulated by the non-radiant features of solar activity [NRSA], and their effect on the level of cover from low clouds. This is able to explain NRSA's link with temperature on timescales of days to decades.

      This controlling role of the NRSA is crucial to the theory of the solar factor because major variation in total solar radiant heat output - RHO - is slow and therefore only able to account for climate changes on timescales from about 50 years upwards.

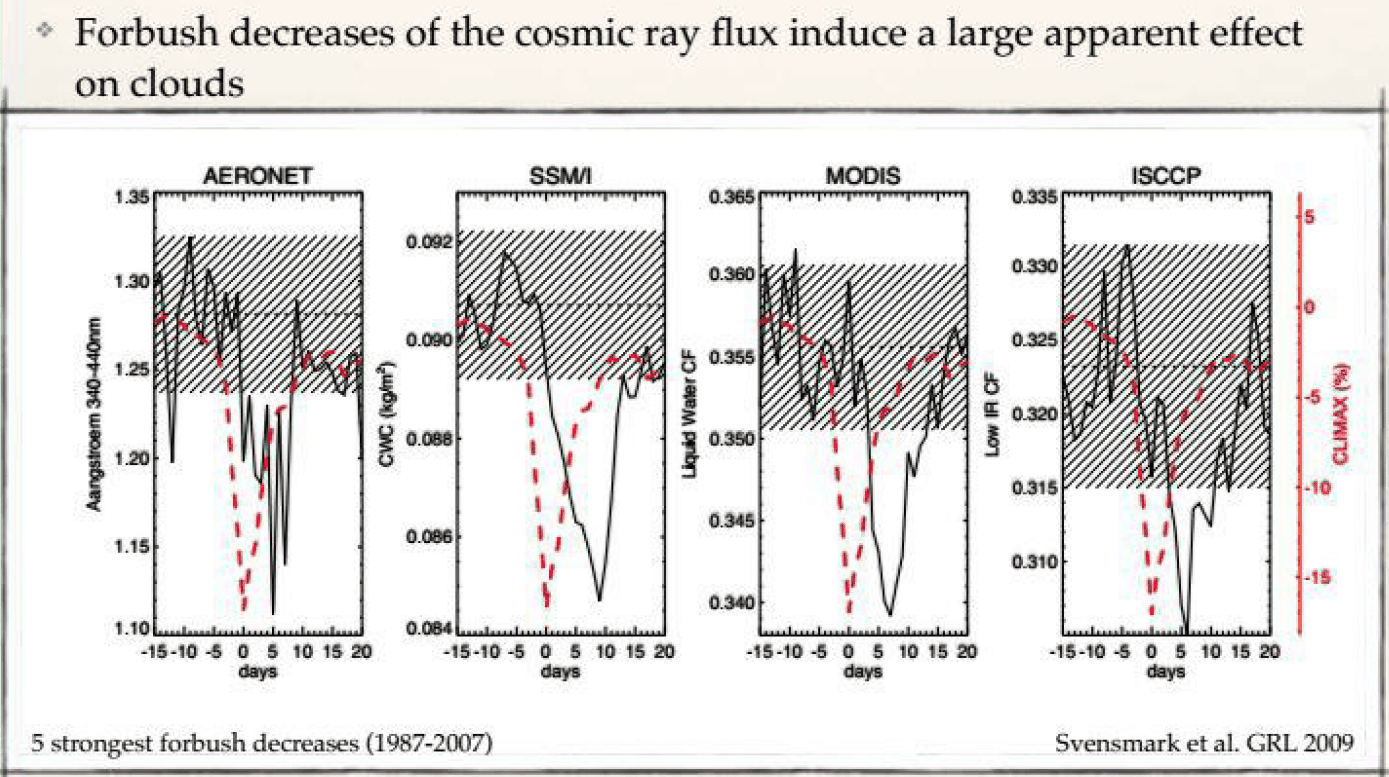
    2. Clinching evidence for the link between variation in cosmic ray flux and the level of cloudiness comes from sudden and and short term decreases in this flux - known as Forbush decreases [see note below] - and their apparent effect on cloudiness within days, as shown by in the diagrams below

      Note on Forbush decreases. These arise from sudden and short term changes to the magnetic field of the solar plasma wind, which follow from ejections of material by the sun known as coronal mass ejections [CME's] - see Wikipedia for details

    3. Rapid AMO warming from the mid 1990’s is covariant with:

      1. A decline in low cloud cover globally, leading to surface warming, and increased upper ocean heat content.
      2. Changes in the vertical distribution of water vapour: Declines in lower stratosphere water vapour leading to cooling. Increases in low-mid troposphere water vapour, at least due to higher SST’s coupled with an increase in surface wind speeds over the oceans, leading to low-mid troposphere warming.
      3. Reduced CO2 uptake in the warmer North Atlantic and in land regions made drier by the warm AMO phase (and increased El Nino).
        All because ocean phases vary inversely to changes in climate forcing.
  8. Best way to measure climate warming?
  9. There are two reliable ways to measure surface warming.

    1. Measuring the temperature of the lower troposphere as measured by satellites. This temperature series began in 1979. It's adantage is in the elimination of the urban heat effect, and it requires no bizarre manipulation
    2. Measures of sea-level rise.

      Because water expands when heated, sea-levels will rise and this expansion can be used as an indirect measure of ocean temperature increase.

      Oceans are a heat sink. Warming of earth's surface mostly goes into the oceans.

References

  1. Scafetta, Nicola, Milani, Franco, Bianchini, Antonio, Ortolani, Sergio, On the astronomical origin of the Hallstatt oscillation found in radiocarbon and climate records throughout the Holocene, Earth Science Reviews (2016), doi: 10.1016/j.earscirev.2016.09.004

Sunday, 17 December 2023

Pirani gauge

The Pirani gauge, invented in 1906, is used to measure vacuum. It has a wire (the sensor or filament), normally gold-plated tungsten or platinum (but has sometimes been nickel), which behaves close to a black body emitter. The emissivity An electical, Wheatsone bridge, circuit is used to keep the temperature of the sensor constant. The whole is put inside a shell so that vacuum inside the shell can be measured down to about 0.001 Torr, up to 1 Torr. This range is dominated by conductive cooling. Below it, radiative cooling dominates. Above 1 Torr: conductive cooling tails off and convective cooling also comes into play. By conductive cooling, I mean the action of gas molecules, in the semi-vacuum, which cool the sensor by conductive loss. Each instrument also has 'end losses' but instruments are calibrated such that end-losses are ignored when measuring.

Consider the chart of showing typical Pirani gauge behavior. My annotations are written in a salmon (pink) colour. The green curve plots pressure (horizontal axis) against power used (vertical axis). Both axes have log scales. The horizontal axis shows pressure in Torr. 760 Torr ~ surface atmospheric pressure (labelled by the sp arrow). Below 0.1 Torr is normally called 'high vacuum'. The vertical axis shows the power used by the instrument to maintain a constant temperature at the Pirani sensor. We assume, that at any particular temperature the emission of infrared (heat) radiation is constant. Because physics shows that's the case: radiative emissions only depend on temperature for a 'black body'.

Over the Low vacuum range [ 1E-02 to 1E+03 (0.01 to 50 Torr), between points labelled by arrows rc to cc ) conductive cooling dominates. So most of the power is used to allay this conductive cooling to keep the Pirani sensor at a constant temperature.

The criticism of the Pirani gauge is that "it's not a good model for the earth". But the actual model of the earth used with backradiation of about 333 is a very, very bad model for the earth; and totally wrong. Climate alarmists are still using this very, very, wrong model today.

Nasif Nahle claims he measured some back-radiation (60 W/m² at night)

From: "Observations of Backradiation during Nighttime and Daytime" by Prof. Nasif Nahle, July 5, 2011

When we place a pyrometer on the ground under direct sunlight with its sensors facing up and measure the solar power flux during daytime, we record solar thermal radiation close to 1000 W/m² not 340 W/m²

If we place the same pyrometer on the ground, adjusted to longwave thermal radiation, during nighttime, the recorded power flux will be around 60 W/m². Nevertheless, the proponents of the greenhouse effect argue that backradiation is 340 W/m² day and night. Additionally, they assert they measured backradiation and it is around 300 W/m².

If we measure the power flux from the surface to the atmosphere during nighttime, we record around 310 W/m². This is five times higher than the power flux recorded from the atmosphere, which is around 60 W/m²

Friday, 3 November 2023

Climate models for politicians - comment on,

Reblog from Mar 20, 2012 at 6:38 AM, comment by Roy Clark on Bishop Hill blog

Most people, including many scientists, have been fooled by the pseudoscience that is hidden in the climate models. Every single result produced by the use of radiative forcing is invalid. The results from all of the models that use the empirical radiative forcing constants given by the IPCC are fraudulent.

The full explanation is little involved, but here goes:

In order to understand the issues it is necessary to go back to the beginning and look at the original 1967 paper by Manabe and Wetherald [J. Atmos. Sci. 24 241-249 (1967), ‘Thermal equilibrium of the atmosphere with a given distribution of relative humidity’. This can be found at http://www.gfdl.noaa.gov/bibliography/related_files/sm6701.pdf The assumptions made in the derivations are clearly stated on the second page.

The Earth’s climate is stable, which means that there is an approximate energy balance between the incoming solar radiation and the outgoing LWIR flux somewhere ‘at the top of the atmosphere’. This is simply a statement of the First Law of Thermodynamics. The energy is conserved – more or less. However, this does not justify the assumption that an ‘average climate equilibrium state’ exists in which the solar flux is exactly balanced by the LWIR flux. This ignores the time dependence of the energy transfer and avoids the application Second Law of Thermodynamics to the surface temperature flux. It assumes that the sun is shining all the time with a single average flux. All of the subsequent mathematical derivations of the equilibrium flux equations and the use of perturbation theory have no basis in physical reality. There are no forcings or feedbacks because there is no equilibrium in the real climate.

Assumption 5 in Manabe and Wetherald is that ‘The heat capacity of the Earth’s surface is zero’. It is assumed that the Earth’s surface temperature is set by black body equilibrium, which is most definitely not the case. There is a significant lag between the peak solar flux and the peak surface temperatures that is characteristic of a classic thermal storage oscillator. The daily surface temperature lags by up to ~2 hours and the seasonal surface temperature lags by a couple of months. . Latent heat and wind driven evaporation are also fundamental in setting the surface temperature, especially over the oceans. The heat capacity of the ground is somewhere around 1.5 MJ.m-3 and that of water is ~4 MJ.m-3.

It is also important to understand that the ‘equilibrium average surface temperature’ calculated by radiative forcing is not a measurable climate variable. It has no existence outside of the ‘equilibrium Earth’ that resides only in the universe of computerized climate fiction found inside these radiative forcing models. .

If we use a reverse argument, an increase of 1 K in a black body surface at 288 K will produce an increase in black body flux of 5.5 W.m-2. This is similar to the increase in downward LWIR flux that would be produced by a doubling of the atmospheric CO2 concentration (to 580 ppm). Reliable atmospheric radiative transfer calculations using HITRAN, untainted by climate science give an increase in flux of about 4 W.m-2. However, there is simply no connection between either of these two numbers and the real surface temperature. The whole radiative forcing argument is nothing more than climate theology.

During the middle of the day, under full summer sun conditions, the peak solar flux is ~1000 W.m-2. The corresponding surface temperature is at least 50 C for dry ground. The increase in LWIR flux for a black body going from 288 to 338 K (+30 C) is about 227 W.m-2. Most of the solar heat is dissipated by convection. Heat is also stored below the surface and released later in the day. It is just impossible for a small change in LWIR flux from CO2 to have any effect on surface temperature when it added correctly to the surface flux balance. At night, convection more or less stops and the surface cools mainly by LWIR emission. The downward LWIR flux from the first 2 km layer of the atmosphere slows the night time surface cooling, but the atmospheric heating process is controlled by convection, not LWIR radiation. Furthermore, this is not an equilibrium process. The troposphere acts as two independent thermal reservoirs. The upper reservoir radiates to space all the time, mainly from the water bands near 5 km. The lower reservoir acts as a night time ‘thermal blanket’. The atmosphere is an open cycle convective heat engine with a radiatively cooled cold reservoir.

Manabe and Wetherald were quite honest about what they were doing. They simply produced an invalid hypothesis that should have been superseded. Later workers just allowed themselves to be seduced by the mathematics of the flux equations and never bothered to validate the models or investigate the real physics. The result is the global warming dogma that we still have today. And the associated corruption.

Now we get to the fraudulent part. Manabe and Wetherald were quite clear that they were calculating a surface temperature, however it was defined. This means the temperature on the ground that we feel with our bare feet. However, there is no long term record of the surface temperature. Instead, the meteorological surface air temperature (MSAT) was substituted for the surface temperature. This is the ‘weather temperature’ that is the air temperature measured in a ventilated enclosure placed at eye level, 1.5 to 2 m above the ground. It is simply impossible for there to be any observable change in MSAT caused by a small change in LWIR flux at the surface below the weather station enclosure.

The MSAT or weather recorded has been treated as a mathematical number series to be manipulated to ‘prove’ that global warming exists. The correct interpretation of the record is that the minimum MSAT is, approximately, with caveats, a measure of the heat content (lapse rate) of the air mass of the weather system as it passes through. This is usually an indicator of the ocean surface temperatures in the region of origin of the weather system. The maximum MSAT is a measure of the daily surface convection at the MSAT thermometer produce by the solar heating of the ground. This convetive heating is added to the minimum MSAT.

The US continental MSAT record shows a clear peak in the 1930s and 1940s from the dust bowl drought and a second peak from the recent modern maximum. These peaks can be explained using variations in ocean surface temperatures, particularly the Atlantic Multidecadal Oscillation (AMO) and the Pacific Decadal Oscillation (PDO). The observed global warming signal is nothing more that the warming phase of these ocean oscillations with some urban heat island effects and plain old data fiddling added. This has been explained by Joe D’Aleo and others. The oceans and the Earth’s climate have been cooling for over 10 years.

The climate models have been rigged using empirical pseudoscience as follows:

It has been assumed, a-priori that the observed increase in the MSAT record, the mutilated ‘average global temperature anomaly’ has been caused by an increase in atmospheric CO2 concentration. In particular it is assumed, without any justification whatsoever, that an increase in the downward LWIR flux from CO2 of 1 W.m-2 has produced an increase in the ‘average global temperature anomaly’ of 2/3 C. This allows the increase in LWIR flux from an increase in concentration of any ‘greenhouse gas’ to be converted to an increase in surface temperature. However, the real climate fluctuates and is now cooling, so ‘aerosol cooling’ has been added to compensate for the over warming produced by just the LWIR flux from the greenhouse gases. Sulfate aerosols are used for basic cooling and volcanic aerosols are used for ‘fine tuning’. The hindcast is just an empirical fit and the models have no predictive skill whatsoever. The climate models are pure pseudoscience. They are nothing more than the hockey stick propagating itself with aerosol adjustments. This is all climate astrology, not climate science.

However, it is not sufficient to say what is wrong with the climate models, it is necessary to propose a viable replacement, or the global warming acrimony will continue ad nauseam.

Radiative forcing has to be replaced with a dynamic energy transfer model. There is no climate equilibrium and the time dependence of the energy transfer must be explicitly included. Once this is done, CO2 induced global warming disappears. The minimum description requires four thermal reservoirs and six energy transfer process. This is discussed in the book ‘The Dynamic Greenhouse Effect and the Climate Averaging Paradox’. It is available on Amazon. There is also further discussion at http://www.venturaphotonics.com

There has to be a fundamental paradigm shift in the way we describe climate and climate change. There is no climate equilibrium on any time scale and all of the energy transfer processes are dynamic, not static. The sun only shines during the day. Sun wind and water need no help from CO2 to set the Earth’s climate.

Sol Invicto Comiti

The World State [A True Story] | New Class

The World State [A True Story] | New Class by Martin Durkin time 0:00 In recent films, I've started to build an argument t...